Seven strips have these widths: \(\frac{3}{8}\,\text{in}\), \(\frac{1}{2}\,\text{in}\), \(\frac{1}{2}\,\text{in}\), \(\frac{5}{8}\,\text{in}\), \(\frac{5}{8}\,\text{in}\), \(\frac{5}{8}\,\text{in}\), and \(\frac{7}{8}\,\text{in}\).
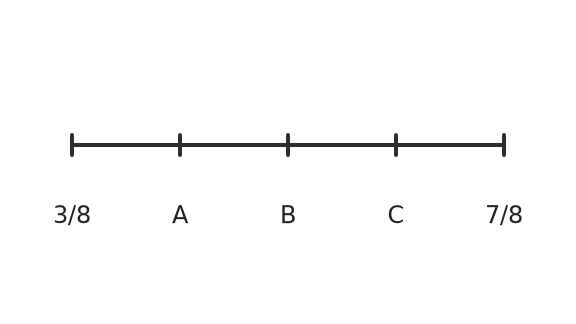
The blank line plot has equally spaced eighth-inch ticks from \(\frac{3}{8}\) inch through \(\frac{7}{8}\) inch. The three interior ticks are labeled A, B, and C. Which lettered tick should have \(3\) X-marks, and what measurement does that tick represent?
Hints
- First identify which width occurs three times in the data.
- Use the equal tick spacing to count by eighths from \(\frac{3}{8}\) to \(\frac{7}{8}\).
- Match the repeated width to the correct lettered position on the blank line plot.
Solution
1. The value occurring \(3\) times is \(\frac{5}{8}\) inch.
2. Starting at \(\frac{3}{8}\), the consecutive eighth-inch ticks are \(\frac{3}{8}, \frac{1}{2}, \frac{5}{8}, \frac{3}{4}, \frac{7}{8}\).
3. The middle interior tick B represents \(\frac{5}{8}\), so B should have \(3\) X-marks.
Answer
B; \(\frac{5}{8}\,\text{in}\)


