Northgate Basketball Club recorded weekly free-throw practice time and free-throw percentage for six players.
<table><tr><th>Practice time (hours)</th><th>Free-throw percentage</th></tr><tr><td>\(1\)</td><td>\(52\)</td></tr><tr><td>\(2\)</td><td>\(56\)</td></tr><tr><td>\(4\)</td><td>\(64\)</td></tr><tr><td>\(5\)</td><td>\(60\)</td></tr><tr><td>\(7\)</td><td>\(72\)</td></tr><tr><td>\(8\)</td><td>\(80\)</td></tr></table>
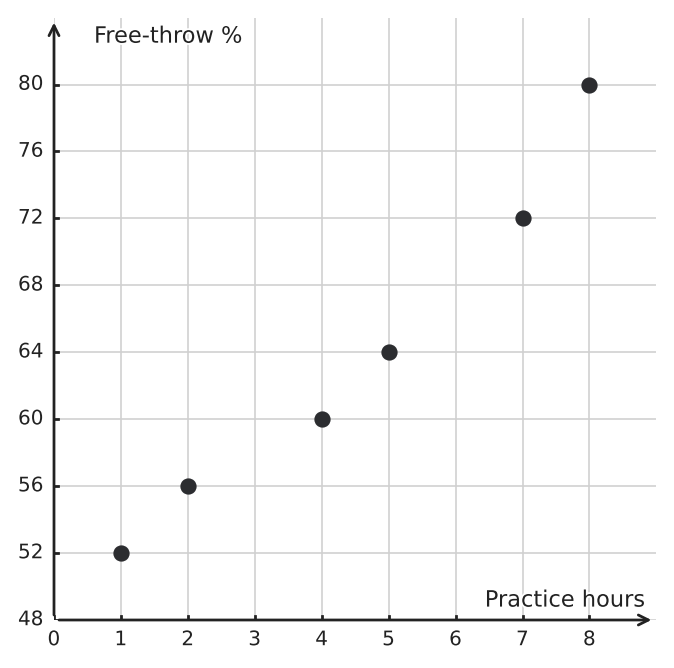
Practice time is the explanatory variable. The candidate scatter plot below contains all six markers, but exactly two markers have the correct horizontal coordinate and the wrong vertical coordinate.
a) Identify the two incorrectly displayed coordinates and give the correct coordinate for each point.
b) State how far and in which vertical direction each incorrect marker must move.
c) After the corrections, describe the direction, form, and strength of the association.
Hints
- Match each table row to a point using both its horizontal and vertical coordinates.
- A point can have the correct \(x\)-coordinate and still be plotted incorrectly if its \(y\)-coordinate is wrong.
- Describe the association only after correcting the two misplaced markers.
Solution
1. Each row must be plotted as \((\text{practice time},\text{free-throw percentage})\).
2. The candidate plot correctly shows \((1,52)\), \((2,56)\), \((7,72)\), and \((8,80)\).
3. At \(x=4\), the plot shows \((4,60)\), but the table requires \((4,64)\). That marker must move up \(4\) percentage points.
4. At \(x=5\), the plot shows \((5,64)\), but the table requires \((5,60)\). That marker must move down \(4\) percentage points.
5. After correction, the points rise overall from left to right and stay fairly close to a straight-line trend, with a modest dip at \((5,60)\). The association is strong, positive, and approximately linear.
Answer
a) \((4,60)\) should be \((4,64)\), and \((5,64)\) should be \((5,60)\).
b) Move the marker at \(x=4\) up \(4\) percentage points and the marker at \(x=5\) down \(4\) percentage points.
c) Strong positive, approximately linear association.


