Aimathic
Login | English | Deutsch

Free Math Worksheets

Build your own math worksheets from 21,000 problems for grades 3 to 12, from fractions to calculus. Every problem includes step-by-step solutions.

Average and instantaneous rate of change

Click problems to add them to your worksheet.

52892712
Find the slope of the tangent line to \(f(x) = 0.8x-5\) at each x-value. a) \(x = 4\) b) \(x = a\)

Hints

- Identify the slope in the form \(mx+b\). - Decide whether the slope of a linear function changes from point to point. - A tangent line to a straight line is the line itself.

Solution

1. The function \(f(x) = 0.8x-5\) is linear. 2. A linear function of the form \(f(x) = mx+b\) has constant slope \(m\). 3. Here, \(m = 0.8\), so the tangent-line slope is \(0.8\) at every x-value.

Answer

a) \(0.8\) b) \(0.8\)
51010312
A rocket’s distance traveled, \(s\) (in \(\text{km}\)), is modeled by \(s = 3t^2\), where \(t\) is time in minutes. Find the rocket’s average speed from \(t = 4\,\text{min}\) to \(t = 6\,\text{min}\).

Hints

- What formula gives average speed from a change in distance and a change in time? - Find the rocket’s distance at the beginning and end of the time interval. - Think about the difference quotient.

Solution

1. Find the distance at \(t = 4\): \(s(4) = 3 \cdot 4^2 = 48\). 2. Find the distance at \(t = 6\): \(s(6) = 3 \cdot 6^2 = 108\). 3. Compute the change in distance: \(\Delta s = 108 - 48 = 60\). 4. Compute the change in time: \(\Delta t = 6 - 4 = 2\). 5. The average speed is \(\frac{\Delta s}{\Delta t} = \frac{60}{2} = 30\,\frac{\text{km}}{\text{min}}\).

Answer

\(30\,\frac{\text{km}}{\text{min}}\)
52214312
Let \(f(x) = \frac{1}{2}x^3 - 2x\). Find the average rate of change of \(f\) over each interval: 1. \([-2, 0]\) 2. \([1, 4]\)

Hints

- Recall the difference-quotient formula for average rate of change. - How do you evaluate a function at a given input? - Be especially careful with signs when substituting negative values. - Geometrically, what does the result tell you about the secant line through the endpoint points?

Solution

1. Evaluate the endpoints: \(f(-2) = \frac{1}{2} \cdot (-2)^3 - 2 \cdot (-2) = -4 + 4 = 0\) and \(f(0) = 0\). Then \(\frac{f(0) - f(-2)}{0 - (-2)} = \frac{0 - 0}{2} = 0\). 2. Evaluate the endpoints: \(f(1) = \frac{1}{2} \cdot 1^3 - 2 \cdot 1 = -1.5\) and \(f(4) = \frac{1}{2} \cdot 4^3 - 2 \cdot 4 = 32 - 8 = 24\). Then \(\frac{f(4) - f(1)}{4 - 1} = \frac{24 - (-1.5)}{3} = \frac{25.5}{3} = 8.5\).

Answer

1. \(0\) 2. \(8.5\)
52214412
Let \(h(x) = -x^2 + 6x - 5\). Find the average rate of change of \(h\) over \([0, 2]\) and \([3, 5]\).

Hints

- Decide which endpoint values belong in the numerator and denominator of the difference quotient. - First calculate all needed values of \(h(x)\). - Work step by step and be careful when subtracting negative values.

Solution

1. For \([0, 2]\), \(h(0) = -5\) and \(h(2) = -2^2 + 6 \cdot 2 - 5 = 3\). Thus, \(\frac{h(2) - h(0)}{2 - 0} = \frac{3 - (-5)}{2} = 4\). 2. For \([3, 5]\), \(h(3) = -3^2 + 6 \cdot 3 - 5 = 4\) and \(h(5) = -5^2 + 6 \cdot 5 - 5 = 0\). Thus, \(\frac{h(5) - h(3)}{5 - 3} = \frac{0 - 4}{2} = -2\).

Answer

For \([0, 2]\), the average rate of change is \(4\). For \([3, 5]\), the average rate of change is \(-2\).
52214512
Let \(f(x) = 2x^2 - 4x\). Find the average rate of change of \(f\) over each interval: a) \([2, 4]\) b) \([2, 2.5]\)

Hints

- Recall the connection between average rate of change and the slope of a secant line. - Which values belong in the difference quotient? - Check your function values at \(x = 2\), \(x = 4\), and \(x = 2.5\).

Solution

1. Evaluate the needed function values: \(f(2) = 2 \cdot 2^2 - 4 \cdot 2 = 0\), \(f(4) = 2 \cdot 4^2 - 4 \cdot 4 = 16\), and \(f(2.5) = 2 \cdot 2.5^2 - 4 \cdot 2.5 = 12.5 - 10 = 2.5\). 2. Over \([2, 4]\), \(\frac{f(4) - f(2)}{4 - 2} = \frac{16 - 0}{2} = 8\). 3. Over \([2, 2.5]\), \(\frac{f(2.5) - f(2)}{2.5 - 2} = \frac{2.5 - 0}{0.5} = 5\).

Answer

a) \(8\) b) \(5\)
52214612
Let \(g(x) = \frac{4}{x}\), where \(x \ne 0\). Find the average rate of change of \(g\) over \([1, 4]\) and \([1, 1.6]\).

Hints

- What is the difference-quotient formula over an interval \([a, b]\)? - Be careful with signs when substituting the function values. - A quick sketch of the reciprocal function can help you check whether the rates should be positive or negative.

Solution

1. Evaluate the needed function values: \(g(1) = 4\), \(g(4) = 1\), and \(g(1.6) = 2.5\). 2. Over \([1, 4]\), \(\frac{g(4) - g(1)}{4 - 1} = \frac{1 - 4}{3} = -1\). 3. Over \([1, 1.6]\), \(\frac{g(1.6) - g(1)}{1.6 - 1} = \frac{2.5 - 4}{0.6} = -2.5\).

Answer

Over \([1, 4]\), the average rate of change is \(-1\). Over \([1, 1.6]\), the average rate of change is \(-2.5\).
52214912
Temperatures were recorded in a city during one day. The table shows the measurements at different times, where \(t\) is the number of hours after midnight. <table> <tr> <td>Time \(t\) (in \(\text{h}\))</td> <td>\(0\)</td> <td>\(4\)</td> <td>\(8\)</td> <td>\(12\)</td> <td>\(16\)</td> <td>\(20\)</td> <td>\(24\)</td> </tr> <tr> <td>Temperature \(T\) (in \(^\circ\text{C}\))</td> <td>\(5\)</td> <td>\(2\)</td> <td>\(6\)</td> <td>\(15\)</td> <td>\(19\)</td> <td>\(13\)</td> <td>\(7\)</td> </tr> </table> Find the average rate of change of the temperature over each interval: a) The entire 24-hour period, from \(t = 0\) to \(t = 24\). b) The early morning, from \(t = 4\) to \(t = 8\). c) From \(t = 8\) to \(t = 16\). d) The evening, from \(t = 16\) to \(t = 24\).

Hints

- What calculation gives the average change over an interval? - Choose the table entries at the two endpoints of each interval. - What does a negative result mean in the context of temperature? - Divide the change in temperature by the change in time.

Solution

1. Over \([0, 24]\), \(\frac{T(24) - T(0)}{24 - 0} = \frac{7 - 5}{24} = \frac{1}{12} \approx 0.083\,\frac{^\circ\text{C}}{\text{h}}\). 2. Over \([4, 8]\), \(\frac{T(8) - T(4)}{8 - 4} = \frac{6 - 2}{4} = 1\,\frac{^\circ\text{C}}{\text{h}}\). 3. Over \([8, 16]\), \(\frac{T(16) - T(8)}{16 - 8} = \frac{19 - 6}{8} = \frac{13}{8} = 1.625\,\frac{^\circ\text{C}}{\text{h}}\). 4. Over \([16, 24]\), \(\frac{T(24) - T(16)}{24 - 16} = \frac{7 - 19}{8} = -1.5\,\frac{^\circ\text{C}}{\text{h}}\).

Answer

a) \(\frac{1}{12}\,\frac{^\circ\text{C}}{\text{h}} \approx 0.083\,\frac{^\circ\text{C}}{\text{h}}\) b) \(1\,\frac{^\circ\text{C}}{\text{h}}\) c) \(1.625\,\frac{^\circ\text{C}}{\text{h}}\) d) \(-1.5\,\frac{^\circ\text{C}}{\text{h}}\)
52215012
A remote-controlled car travels along a straight test track. Its distance \(s\) from the starting point was recorded as a function of time \(t\). <table> <tr> <td>Time \(t\) (in \(\text{s}\))</td> <td>\(0\)</td> <td>\(2\)</td> <td>\(4\)</td> <td>\(6\)</td> <td>\(8\)</td> <td>\(10\)</td> </tr> <tr> <td>Distance \(s\) (in \(\text{m}\))</td> <td>\(0\)</td> <td>\(3.2\)</td> <td>\(12.8\)</td> <td>\(28.8\)</td> <td>\(51.2\)</td> <td>\(80.0\)</td> </tr> </table> Find the average speed for: a) The first 4 seconds. b) The interval from 4 to 8 seconds. c) The final 2 seconds of the measurement. d) The entire observed time interval.

Hints

- How are distance, time, and average speed related? - Recall the slope formula for a secant line through two points on a graph. - What units should the speed have here? - Compare your answers. What do they suggest about how the car’s speed changes?

Solution

1. Over \([0, 4]\), \(\frac{s(4) - s(0)}{4 - 0} = \frac{12.8 - 0}{4} = 3.2\,\frac{\text{m}}{\text{s}}\). 2. Over \([4, 8]\), \(\frac{s(8) - s(4)}{8 - 4} = \frac{51.2 - 12.8}{4} = 9.6\,\frac{\text{m}}{\text{s}}\). 3. Over \([8, 10]\), \(\frac{s(10) - s(8)}{10 - 8} = \frac{80.0 - 51.2}{2} = 14.4\,\frac{\text{m}}{\text{s}}\). 4. Over \([0, 10]\), \(\frac{s(10) - s(0)}{10 - 0} = \frac{80.0 - 0}{10} = 8.0\,\frac{\text{m}}{\text{s}}\).

Answer

a) \(3.2\,\frac{\text{m}}{\text{s}}\) b) \(9.6\,\frac{\text{m}}{\text{s}}\) c) \(14.4\,\frac{\text{m}}{\text{s}}\) d) \(8.0\,\frac{\text{m}}{\text{s}}\)
52215912
A hot drink cools in a room. Its temperature \(T\) was measured at several times \(t\). <table border="1"> <tr> <td>Time \(t\) (in \(\text{min}\))</td> <td>\(0\)</td> <td>\(4\)</td> <td>\(10\)</td> <td>\(20\)</td> </tr> <tr> <td>Temperature \(T\) (in \(^\circ\text{C}\))</td> <td>\(92\)</td> <td>\(76\)</td> <td>\(58\)</td> <td>\(38\)</td> </tr> </table> 1. Find the average rate of change of the temperature over \([0, 4]\) and over \([4, 20]\). 2. Interpret the sign of each result in context. 3. Give a common name for the quantity you calculated.

Hints

- How do you find the slope through two data points? - What does the result represent per unit of time? - Does the temperature rise or fall as time passes? - What phrase describes how quickly an object becomes cooler?

Solution

1. Over \([0, 4]\), \(\frac{T(4) - T(0)}{4 - 0} = \frac{76 - 92}{4} = -4\,\frac{^\circ\text{C}}{\text{min}}\). Over \([4, 20]\), \(\frac{T(20) - T(4)}{20 - 4} = \frac{38 - 76}{16} = -2.375\,\frac{^\circ\text{C}}{\text{min}}\). 2. The negative signs indicate that the drink’s temperature decreases over time. 3. In this context, the quantity is the average cooling rate, or average rate of temperature change.

Answer

1. Over \([0, 4]\): \(-4\,\frac{^\circ\text{C}}{\text{min}}\) Over \([4, 20]\): \(-2.375\,\frac{^\circ\text{C}}{\text{min}}\) 2. The negative signs mean that the drink is cooling. 3. The average cooling rate.
52217112
Match each quantity \(G\) with its correct unit, the meaning of its instantaneous rate of change \(r\), and the unit of \(r\). The entries in the last three columns are choices; they are not intended to match row by row. For \(E(t)\), \(t\) is measured in seconds; for \(h(t)\), \(t\) is measured in minutes; \(s\) is measured in feet; and \(q\) counts items. <table> <thead> <tr> <th>Quantity \(G\)</th> <th>Unit of \(G\)</th> <th>Meaning of \(r\)</th> <th>Unit of \(r\)</th> </tr> </thead> <tbody> <tr> <td>Energy \(E(t)\)</td> <td>\(\text{lb}\)</td> <td>marginal profit</td> <td>\(\frac{\text{in.}}{\text{min}}\)</td> </tr> <tr> <td>Fill height \(h(t)\)</td> <td>\(\text{J}\)</td> <td>power</td> <td>\(\frac{\$}{\text{item}}\)</td> </tr> <tr> <td>Mass \(m(s)\) of a rope</td> <td>\(\text{in.}\)</td> <td>rising speed</td> <td>\(\text{W}\), or \(\frac{\text{J}}{\text{s}}\)</td> </tr> <tr> <td>Profit \(P(q)\)</td> <td>\(\$\)</td> <td>linear mass density</td> <td>\(\frac{\text{lb}}{\text{ft}}\)</td> </tr> </tbody> </table>

Hints

- First identify the unit in which each original quantity is measured. - An instantaneous rate describes how the dependent quantity changes per unit of the independent variable. - The unit of a rate is the dependent-variable unit divided by the independent-variable unit. - Use the standard physical or business term for each type of rate.

Solution

1. Energy \(E(t)\) is measured in joules. Its rate of change with respect to time is power, measured in watts, where \(1\,\text{W} = 1\,\frac{\text{J}}{\text{s}}\). 2. Fill height \(h(t)\) is measured in inches. Its rate of change with respect to time is a rising speed, measured in inches per minute. 3. Rope mass \(m(s)\) is measured in pounds. Because mass depends on rope length \(s\), its rate of change is linear mass density, measured in pounds per foot. 4. Profit \(P(q)\) is measured in dollars. Its rate of change with respect to the number of items \(q\) is marginal profit, measured in dollars per item.

Answer

Energy \(E(t)\): \(\text{J}\) → power → \(\text{W}\), or \(\frac{\text{J}}{\text{s}}\) Fill height \(h(t)\): \(\text{in.}\) → rising speed → \(\frac{\text{in.}}{\text{min}}\) Rope mass \(m(s)\): \(\text{lb}\) → linear mass density → \(\frac{\text{lb}}{\text{ft}}\) Profit \(P(q)\): \(\$\) → marginal profit → \(\frac{\$}{\text{item}}\)
52218312
A function \(A\) gives the area of a lake covered by algae, where \(A(t)\) is measured in square meters and \(t\) is the number of days after the first measurement. Interpret each statement in context. a) \(A(10) = 50\) b) \(\frac{A(10)-A(0)}{10} = 4\) c) \(A'(10) = 6\)

Hints

- Determine the units of each expression. - Distinguish between a time interval and one instant. - A function value gives an amount, an average rate describes an interval, and a derivative describes an instant.

Solution

1. The statement \(A(10) = 50\) means that \(10\) days after the first measurement, algae cover \(50\,\text{m}^2\) of the lake. 2. The quotient \(\frac{A(10)-A(0)}{10} = 4\) is the average rate of change over the first \(10\) days. The covered area grew by an average of \(4\,\text{m}^2\) per day. 3. The derivative value \(A'(10) = 6\) is the instantaneous growth rate on day \(10\). At that time, the covered area is growing at \(6\,\text{m}^2\) per day.

Answer

a) After \(10\) days, algae cover \(50\,\text{m}^2\). b) During the first \(10\) days, the covered area grew by an average of \(4\,\frac{\text{m}^2}{\text{day}}\). c) On day \(10\), the covered area is growing at \(6\,\frac{\text{m}^2}{\text{day}}\).
52218412
A function \(s\) gives a vehicle’s distance traveled during acceleration, where \(s(t)\) is measured in meters and \(t\) in seconds after the start. Interpret each statement in context. a) \(s(4) = 40\) b) \(\frac{s(10)-s(0)}{10} = 25\) c) \(s'(10) = 45\)

Hints

- How are distance traveled and speed related? - Distinguish between an average over an interval and a value at one instant. - Distance divided by time has speed units.

Solution

1. The statement \(s(4) = 40\) means that after \(4\) seconds, the vehicle has traveled \(40\) meters. 2. The quotient \(\frac{s(10)-s(0)}{10} = 25\) is the average speed over \([0, 10]\), so the vehicle averaged \(25\,\frac{\text{m}}{\text{s}}\) during the first \(10\) seconds. 3. The derivative value \(s'(10) = 45\) is the instantaneous speed at \(t = 10\), so the vehicle is traveling at \(45\,\frac{\text{m}}{\text{s}}\) at that instant.

Answer

a) After \(4\) seconds, the vehicle has traveled \(40\,\text{m}\). b) Its average speed during the first \(10\) seconds is \(25\,\frac{\text{m}}{\text{s}}\). c) Its instantaneous speed at \(t = 10\) is \(45\,\frac{\text{m}}{\text{s}}\).
52233712
Let \(f(x) = \frac{1}{2}x^3 - 2x\). First predict whether the average rate of change of \(f\) over \([1, 3]\) is positive or negative. Then verify your prediction by calculating the difference quotient.

Hints

- Compare the function values at the two endpoints. - What does the change in the function values suggest about the secant slope? - Recall the average-rate-of-change formula. - Be careful when subtracting a negative value.

Solution

1. Evaluate the endpoints: \(f(1) = \frac{1}{2} \cdot 1^3 - 2 \cdot 1 = -1.5\) and \(f(3) = \frac{1}{2} \cdot 3^3 - 2 \cdot 3 = 7.5\). 2. Because \(f(3) > f(1)\), the average rate of change should be positive. 3. Calculate the difference quotient: \(\frac{f(3) - f(1)}{3 - 1} = \frac{7.5 - (-1.5)}{2} = \frac{9}{2} = 4.5\). The positive result confirms the prediction.

Answer

The average rate of change is positive, and its value is \(4.5\).
52233812
Let \(g(x) = \frac{8}{x^2}\) on the interval \([1, 4]\). First decide whether the average rate of change over this interval is positive or negative, and briefly justify your prediction. Then calculate its exact value.

Hints

- How does \(\frac{8}{x^2}\) change as positive \(x\) increases? - What sign does a secant slope have when the second point is below the first? - Substitute the endpoint values into the difference quotient. - A secant slope is the average rate of change between two graph points.

Solution

1. Evaluate the endpoints: \(g(1) = 8\) and \(g(4) = \frac{8}{16} = \frac{1}{2}\). 2. Since \(g(4) < g(1)\), the function decreases from the left endpoint to the right endpoint, so the average rate of change is negative. 3. Calculate the difference quotient: \(\frac{g(4) - g(1)}{4 - 1} = \frac{\frac{1}{2} - 8}{3} = \frac{-\frac{15}{2}}{3} = -\frac{5}{2}\).

Answer

The average rate of change is negative, and its exact value is \(-\frac{5}{2}\).
52893512
The function \(h(t)\) gives the height of a sunflower in inches \(t\) days after it sprouts. Interpret each expression in context and give its units. a) \(h(t+7)-h(t)\) b) \(\frac{h(t+\Delta t)-h(t)}{\Delta t}\) c) \(h'(t)\)

Hints

- Identify what the input and output of the function represent. - A difference of output values represents a change in height. - Dividing a height change by a time change gives a growth rate. - The derivative represents an instantaneous rate of change.

Solution

1. \(h(t+7)-h(t)\) is the sunflower's change in height during the seven days after day \(t\). Its units are inches. 2. \(\frac{h(t+\Delta t)-h(t)}{\Delta t}\) is the sunflower's average growth rate from day \(t\) to day \(t+\Delta t\). Its units are inches per day. 3. \(h'(t)\) is the sunflower's instantaneous growth rate on day \(t\). Its units are inches per day.

Answer

a) The change in height over seven days, measured in inches b) The average growth rate from \(t\) to \(t+\Delta t\), measured in inches per day c) The instantaneous growth rate at time \(t\), measured in inches per day
52893612
A test vehicle moves along a straight track. The function \(s(t)\) gives the vehicle's position in meters at time \(t\) seconds. Explain the physical meaning of each expression. a) \(\frac{s(t_2)-s(t_1)}{t_2-t_1}\) b) \(s'(t)\)

Hints

- Compare displacement over an interval with motion at one instant. - A difference quotient gives an average rate over an interval. - A derivative gives an instantaneous rate at one time.

Solution

1. \(\frac{s(t_2)-s(t_1)}{t_2-t_1}\) is the vehicle's average velocity from time \(t_1\) to time \(t_2\), measured in meters per second. 2. \(s'(t)\) is the vehicle's instantaneous velocity at time \(t\), measured in meters per second.

Answer

a) The average velocity from \(t_1\) to \(t_2\), measured in meters per second b) The instantaneous velocity at time \(t\), measured in meters per second
52893712
A hot-air balloon rises after takeoff. The function \(h(t)\) gives its height in feet at time \(t\) minutes. Interpret each expression in context and give its units. a) \(h(t)-h(t_0)\) b) \(\frac{h(t)-h(t_0)}{t-t_0}\) c) \(h'(t_0)\)

Hints

- Determine the units of the numerator and denominator in each expression. - Distinguish between a change over a time interval and a rate at one instant. - Relate the derivative of height to vertical velocity.

Solution

1. \(h(t)-h(t_0)\) is the balloon's change in height from time \(t_0\) to time \(t\). Its units are feet. 2. \(\frac{h(t)-h(t_0)}{t-t_0}\) is the balloon's average vertical velocity from time \(t_0\) to time \(t\). Its units are feet per minute. 3. \(h'(t_0)\) is the balloon's instantaneous vertical velocity at time \(t_0\). Its units are feet per minute.

Answer

a) The change in height from \(t_0\) to \(t\), measured in feet b) The average vertical velocity from \(t_0\) to \(t\), measured in feet per minute c) The instantaneous vertical velocity at \(t_0\), measured in feet per minute
52894912
The derivative of a function \(f\) is constant: \(f'(x)=c\) for every real number \(x\). The graph of \(f\) passes through \(P(0, 1.5)\) and \(Q(5, 9)\). 1. Find \(c\). 2. Find an equation for \(f\). 3. Describe how the value of \(f\) changes whenever \(x\) increases by exactly \(1\).

Hints

- What type of function has the same slope at every input? - Use the two given points to calculate the slope of the line. - Interpret the derivative as the change in the function value per unit change in \(x\). - One given point lies on the \(y\)-axis.

Solution

1. A function with a constant derivative is linear, and the derivative equals its slope. Using \(P\) and \(Q\), \(c=\frac{9-1.5}{5-0}=\frac{7.5}{5}=1.5\). 2. Write \(f(x)=mx+b\). Since \(m=1.5\) and \(P(0, 1.5)\) gives \(b=1.5\), the function is \(f(x)=1.5x+1.5\). 3. The slope gives the change in the function value for an increase of \(1\) in \(x\). Therefore, the value of \(f\) increases by \(1.5\) each time \(x\) increases by \(1\).

Answer

1. \(c=1.5\) 2. \(f(x)=1.5x+1.5\) 3. The function value increases by \(1.5\).
53234112
Use the graph of \(f\) to find the average rate of change over each interval: a) \([-1, 1]\) b) \([0, 2]\)
Figure for problem 532341

Hints

- Write the difference-quotient formula over an interval \([a, b]\). - Read the function values at the endpoints from the graph. - Find the change in the function values and divide by the change in \(x\). - Substitute the values carefully.

Solution

1. Read the endpoint values from the graph. For part a, \(f(-1) = -1\) and \(f(1) = 3\). For part b, \(f(0) = 1\) and \(f(2) = -1\). 2. Over \([-1, 1]\), \(\frac{f(1) - f(-1)}{1 - (-1)} = \frac{3 - (-1)}{2} = 2\). 3. Over \([0, 2]\), \(\frac{f(2) - f(0)}{2 - 0} = \frac{-1 - 1}{2} = -1\).

Answer

a) \(2\) b) \(-1\)
53234412
The graph shows the height \(h(t)\), in meters, of a research drone during a test flight, where \(t\) is measured in minutes. a) Find the average rate of change of the height over \([1, 5]\). Include units. b) Find the average rate of change over \([6, 8]\) and explain the meaning of its sign in context.
Figure for problem 532344

Hints

- Read the coordinates of the relevant points from the graph. - Divide the change in height by the elapsed time. - Recall the secant-slope formula. - What does a positive or negative rate mean for the drone’s motion?

Solution

1. From the graph, \(h(1) = 3\,\text{m}\) and \(h(5) = 17\,\text{m}\). 2. Over \([1, 5]\), \(\frac{h(5) - h(1)}{5 - 1} = \frac{17 - 3}{4} = 3.5\,\frac{\text{m}}{\text{min}}\). 3. From the graph, \(h(6) = 18\,\text{m}\) and \(h(8) = 10\,\text{m}\). 4. Over \([6, 8]\), \(\frac{h(8) - h(6)}{8 - 6} = \frac{10 - 18}{2} = -4\,\frac{\text{m}}{\text{min}}\). 5. The negative sign means that the drone’s altitude decreases during this interval; it descends by an average of \(4\) meters per minute.

Answer

a) \(3.5\,\frac{\text{m}}{\text{min}}\) b) \(-4\,\frac{\text{m}}{\text{min}}\). The negative sign means that the drone descends on average during this interval.
53234612
The three panels show the graphs of \(f\), \(g\), and \(h\), together with their tangent lines at \(x = 2\). Use the tangent lines to find each derivative value. a) \(f'(2)\) b) \(g'(2)\) c) \(h'(2)\)
Figure for problem 532346

Hints

- The derivative at a point is the slope of the tangent line there. - Choose two grid points on each tangent line. - Use \(\frac{\Delta y}{\Delta x}\) to calculate slope. - A horizontal line has slope \(0\).

Solution

1. A derivative value equals the slope of the tangent line at the point of tangency. 2. In panel a), the tangent line passes through \((0, 0)\) and \((2, 2)\), so \(f'(2) = \frac{2-0}{2-0} = 1\). 3. In panel b), the tangent line is horizontal, so \(g'(2) = 0\). 4. In panel c), the tangent line passes through \((1, 3)\) and \((2, 1)\), so \(h'(2) = \frac{1-3}{2-1} = -2\).

Answer

a) \(f'(2) = 1\) b) \(g'(2) = 0\) c) \(h'(2) = -2\)
53236012
Let \(f(x) = -0.5x^3 + 1.5x^2 + 2x\). The graph shows \(f\), the tangent line \(t_0\) at \(x = 0\), and the tangent line \(t_2\) at \(x = 2\). Use the graph to find: a) the average rate of change of \(f\) over \([-1, 1]\), b) the average rate of change of \(f\) over \([2, 4]\), c) the instantaneous rates of change \(f'(0)\) and \(f'(2)\).
Figure for problem 532360

Hints

- Use the slope formula for the secant line through the endpoint graph points. - Read the required function values directly from the graph. - An instantaneous rate of change is the slope of a tangent line. - Choose two easy-to-read points on each tangent line.

Solution

1. From the graph, \(f(-1) = 0\) and \(f(1) = 3\). Therefore, the average rate over \([-1, 1]\) is \(\frac{3 - 0}{1 - (-1)} = \frac{3}{2} = 1.5\). 2. From the graph, \(f(2) = 6\) and \(f(4) = 0\). Therefore, the average rate over \([2, 4]\) is \(\frac{0 - 6}{4 - 2} = -3\). 3. The instantaneous rate is the slope of the corresponding tangent line. The line \(t_0\) passes through \((0, 0)\) and \((1, 2)\), so \(f'(0) = \frac{2 - 0}{1 - 0} = 2\). The line \(t_2\) passes through \((1, 4)\) and \((2, 6)\), so \(f'(2) = \frac{6 - 4}{2 - 1} = 2\).

Answer

a) \(1.5\) b) \(-3\) c) \(f'(0) = 2\) and \(f'(2) = 2\)
53236112
The graph of \(f\) is shown with tangent lines labeled \(t_{-2}\), \(t_0\), and \(t_2\) at \(x = -2\), \(x = 0\), and \(x = 2\), respectively. Use the marked points on the tangent lines to find each derivative value. a) \(f'(-2)\) b) \(f'(0)\) c) \(f'(2)\)
Figure for problem 532361

Hints

- The derivative at a point equals the slope of the tangent line there. - Choose two marked points on each tangent line. - Calculate each slope as rise divided by run. - Pay close attention to negative coordinates when subtracting.

Solution

1. On \(t_{-2}\), use \((-3, 1)\) and \((-1, 3)\): \(f'(-2) = \frac{3-1}{-1-(-3)} = 1\). 2. On \(t_0\), use \((-1, 2)\) and \((1, -2)\): \(f'(0) = \frac{-2-2}{1-(-1)} = -2\). 3. On \(t_2\), use \((1, -3)\) and \((3, -1)\): \(f'(2) = \frac{-1-(-3)}{3-1} = 1\).

Answer

a) \(f'(-2) = 1\) b) \(f'(0) = -2\) c) \(f'(2) = 1\)
53241512
For each panel, find the instantaneous rate of change at the marked point \(P\) by using the drawn tangent line. a) Graph of \(f\) at \(P(2, 0)\) b) Graph of \(g\) at \(P(2, 1)\) c) Graph of \(h\) at \(P(1, 1)\)
Figure for problem 532415

Hints

- The instantaneous rate of change equals the slope of the tangent line. - Choose two grid points on each tangent line. - Use slope \(=\frac{\text{rise}}{\text{run}}\). - Check the vertical scale in panel c).

Solution

1. In panel a), the tangent line passes through \((2, 0)\) and \((3, 2)\). Its slope is \(\frac{2-0}{3-2} = 2\). 2. In panel b), the tangent line passes through \((2, 1)\) and \((3, 0)\). Its slope is \(\frac{0-1}{3-2} = -1\). 3. In panel c), the tangent line passes through \((1, 1)\) and \((3, 2)\). Its slope is \(\frac{2-1}{3-1} = 0.5\).

Answer

a) \(2\) b) \(-1\) c) \(0.5\)
53249512
The graph shows the tidal water level \(h(t)\), in meters, in a harbor over a 12-hour period, where \(t\) is measured in hours. a) Read \(h(0)\) and \(h(6)\) from the graph, and find the average rate of change over \([0, 6]\). b) Read \(h(2)\) and \(h(8)\) from the graph, and find the average rate of change over \([2, 8]\). c) Interpret the value from part a in context.
Figure for problem 532495

Hints

- First read the water levels at the interval endpoints. - Use \(\frac{h(b) - h(a)}{b - a}\). - Divide the water-level unit by the time unit. - What does a positive rate mean for the water level?

Solution

1. From the graph, \(h(0) = 1\,\text{m}\), \(h(6) = 7\,\text{m}\), \(h(2) = 2.5\,\text{m}\), and \(h(8) = 5.5\,\text{m}\). 2. Over \([0, 6]\), \(\frac{h(6) - h(0)}{6 - 0} = \frac{7 - 1}{6} = 1\,\frac{\text{m}}{\text{h}}\). 3. Over \([2, 8]\), \(\frac{h(8) - h(2)}{8 - 2} = \frac{5.5 - 2.5}{6} = 0.5\,\frac{\text{m}}{\text{h}}\). 4. During the first six hours, the water level rises by an average of \(1\) meter per hour.

Answer

a) \(h(0) = 1\,\text{m}\), \(h(6) = 7\,\text{m}\), and the average rate is \(1\,\frac{\text{m}}{\text{h}}\). b) \(h(2) = 2.5\,\text{m}\), \(h(8) = 5.5\,\text{m}\), and the average rate is \(0.5\,\frac{\text{m}}{\text{h}}\). c) The water level rises by an average of \(1\) meter per hour from \(t = 0\) to \(t = 6\).
53249812
Use the graph of \(f\). a) Find the average rate of change of \(f\) over \([-2, -1]\) and over \([-1, 1]\). b) Give one interval over which the average rate of change is \(0\).
Figure for problem 532498

Hints

- Read the function values at the interval endpoints. - Use the average-rate-of-change formula. - When is a fraction equal to zero? - Look for two graph points with the same y-coordinate.

Solution

1. Read the values from the graph: \(f(-2) = 1\), \(f(-1) = 3\), \(f(0) = 1\), \(f(1) = -1\), and \(f(2) = 1\). 2. Over \([-2, -1]\), \(\frac{f(-1) - f(-2)}{-1 - (-2)} = \frac{3 - 1}{1} = 2\). 3. Over \([-1, 1]\), \(\frac{f(1) - f(-1)}{1 - (-1)} = \frac{-1 - 3}{2} = -2\). 4. An average rate of \(0\) occurs when the endpoint function values are equal. Since \(f(-2) = f(0) = f(2) = 1\), possible intervals include \([-2, 0]\), \([0, 2]\), and \([-2, 2]\).

Answer

a) \([-2, -1]\): \(2\) \([-1, 1]\): \(-2\) b) One possible interval is \([-2, 0]\).
53249912
A large water tank is being filled. The graph shows the water volume \(V\), in cubic meters, as a function of time \(t\), in hours. Find the average inflow rate over each interval. Include units. a) \(I_1 = [0, 4]\) b) \(I_2 = [4, 8]\)
Figure for problem 532499

Hints

- Recall the difference-quotient formula. - Read the volume values at the interval endpoints. - Divide the change in volume by the length of the time interval. - The rate unit is volume divided by time.

Solution

1. From the graph, \(V(0) = 0\,\text{m}^3\), \(V(4) = 12\,\text{m}^3\), and \(V(8) = 40\,\text{m}^3\). 2. Over \([0, 4]\), \(\frac{V(4) - V(0)}{4 - 0} = \frac{12 - 0}{4} = 3\,\frac{\text{m}^3}{\text{h}}\). 3. Over \([4, 8]\), \(\frac{V(8) - V(4)}{8 - 4} = \frac{40 - 12}{4} = 7\,\frac{\text{m}^3}{\text{h}}\).

Answer

a) \(3\,\frac{\text{m}^3}{\text{h}}\) b) \(7\,\frac{\text{m}^3}{\text{h}}\)
53250112
The two panels show the graphs of \(f\) and \(g\). Find the average rate of change of each function over each interval: a) \(I_1 = [2, 4]\) b) \(I_2 = [3, 5]\) c) \(I_3 = [4, 6]\) d) \(I_4 = [2, 6]\)
Figure for problem 532501

Hints

- Use the difference quotient over each interval. - Read each function value at the interval endpoints. - The marked points help you read exact coordinates. - Calculate each function separately.

Solution

1. From the graphs, \(f(2) = 3\), \(f(3) = 6\), \(f(4) = 3\), \(f(5) = 0\), and \(f(6) = 3\). Also, \(g(2) = 0\), \(g(3) = 3\), \(g(4) = 4\), \(g(5) = 3\), and \(g(6) = 0\). 2. For \(f\): over \([2, 4]\), the rate is \(\frac{3 - 3}{2} = 0\); over \([3, 5]\), \(\frac{0 - 6}{2} = -3\); over \([4, 6]\), \(\frac{3 - 3}{2} = 0\); and over \([2, 6]\), \(\frac{3 - 3}{4} = 0\). 3. For \(g\): over \([2, 4]\), the rate is \(\frac{4 - 0}{2} = 2\); over \([3, 5]\), \(\frac{3 - 3}{2} = 0\); over \([4, 6]\), \(\frac{0 - 4}{2} = -2\); and over \([2, 6]\), \(\frac{0 - 0}{4} = 0\).

Answer

\(f\): a) \(0\) b) \(-3\) c) \(0\) d) \(0\) \(g\): a) \(2\) b) \(0\) c) \(-2\) d) \(0\)
53250312
The graph of \(f\) and its tangent line \(t\) at \(x = 1\) are shown. Use the tangent line to find \(f'(1)\).
Figure for problem 532503

Hints

- A derivative value equals the slope of the tangent line. - Choose two points on the tangent line whose coordinates can be read exactly. - Use rise divided by run.

Solution

1. The derivative \(f'(1)\) equals the slope of tangent line \(t\). 2. Two readable points on the tangent line are \((1, -1)\) and \((2, 0)\). 3. Calculate the slope: \(\frac{0-(-1)}{2-1} = 1\). 4. Therefore, \(f'(1) = 1\).

Answer

\(f'(1) = 1\)
53250612
The graph of \(f\) has four marked points, \(A\), \(B\), \(C\), and \(D\). a) At which marked points is the slope of the graph negative? b) Order the points from the smallest slope to the largest slope.
Figure for problem 532506

Hints

- A decreasing graph has negative slope; an increasing graph has positive slope. - Imagine a tangent line at each marked point. - A steep downward tangent has a very negative slope. - Compare the steepness at the two points where the graph is increasing.

Solution

1. A graph has negative slope where it decreases from left to right. The graph is decreasing at \(A\) and \(D\), so those points have negative slopes. 2. At \(D\), the graph decreases most steeply, so its slope is the smallest. 3. At \(A\), the graph decreases less steeply, so its slope is greater than the slope at \(D\) but still negative. 4. The graph increases at \(B\) and \(C\). It is steeper at \(C\), so the slope at \(C\) is greater than the slope at \(B\). 5. Therefore, the order is \(D, A, B, C\).

Answer

a) \(A\) and \(D\) b) \(D, A, B, C\)
53250812
The graph of \(f\) includes tangent lines at \(x = 0\), \(x = 2\), and \(x = 4\). a) Use the tangent lines to find \(f'(0)\), \(f'(2)\), and \(f'(4)\). b) Determine whether the derivative is positive, negative, or zero at \(x = -1\), \(x = 1\), and \(x = 5\).
Figure for problem 532508

Hints

- A derivative value equals the slope of the tangent line. - Use two readable grid points on each drawn tangent line. - A horizontal tangent has slope \(0\). - The derivative is positive where the graph rises and negative where it falls.

Solution

1. At \(x = 0\), the tangent line passes through \((0, -1)\) and \((1, -3)\). Its slope is \(\frac{-3-(-1)}{1-0} = -2\), so \(f'(0) = -2\). 2. At \(x = 2\), the tangent line is horizontal, so \(f'(2) = 0\). 3. At \(x = 4\), the tangent line passes through \((4, -1)\) and \((5, 1)\). Its slope is \(\frac{1-(-1)}{5-4} = 2\), so \(f'(4) = 2\). 4. The graph is decreasing at \(x = -1\) and \(x = 1\), so \(f'(-1)<0\) and \(f'(1)<0\). 5. The graph is increasing at \(x = 5\), so \(f'(5)>0\).

Answer

a) \(f'(0) = -2\), \(f'(2) = 0\), and \(f'(4) = 2\) b) \(f'(-1)<0\), \(f'(1)<0\), and \(f'(5)>0\)
53251012
The graph shows the water level \(h(t)\), in meters, in a hydroelectric reservoir, where \(t\) is the number of hours after midnight. a) Find the average rate of change of the water level over each interval. Include units. 1. \([0, 2]\) 2. \([2, 6]\) 3. \([10, 12]\) b) Find the average rate of change over the entire 12-hour period, \([0, 12]\), and interpret the result. c) At what time is the water level highest, and what is the maximum level?
Figure for problem 532510

Hints

- Recall the difference-quotient formula and its geometric meaning. - Read the endpoint values carefully from the graph. - What does a negative average rate mean for the water level? - How should a zero average rate over the full interval be interpreted?

Solution

1. From the graph, \(h(0) = 0\,\text{m}\), \(h(2) = 5\,\text{m}\), \(h(6) = 27\,\text{m}\), \(h(10) = 25\,\text{m}\), and \(h(12) = 0\,\text{m}\). 2. The rates are: over \([0, 2]\), \(\frac{5 - 0}{2} = 2.5\,\frac{\text{m}}{\text{h}}\); over \([2, 6]\), \(\frac{27 - 5}{4} = 5.5\,\frac{\text{m}}{\text{h}}\); and over \([10, 12]\), \(\frac{0 - 25}{2} = -12.5\,\frac{\text{m}}{\text{h}}\). 3. Over \([0, 12]\), \(\frac{h(12) - h(0)}{12} = 0\,\frac{\text{m}}{\text{h}}\). The beginning and ending levels are equal, so the net change over 12 hours is zero. 4. The graph reaches its maximum at \(t = 8\,\text{h}\), where \(h(8) = 32\,\text{m}\).

Answer

a) 1. \(2.5\,\frac{\text{m}}{\text{h}}\) 2. \(5.5\,\frac{\text{m}}{\text{h}}\) 3. \(-12.5\,\frac{\text{m}}{\text{h}}\) b) \(0\,\frac{\text{m}}{\text{h}}\). The water level has no net change over the 12-hour period. c) At \(t = 8\,\text{h}\), the maximum water level is \(32\,\text{m}\).
53366112
Four function graphs, labeled \(A\) through \(D\), are shown. Match each graph with the correct derivative value at \(x = 1\). (1) \(f'(1) = 0\) (2) \(f'(1) = 2\) (3) \(f'(1) = -2\) (4) \(f'(1) = 1\)
Figure for problem 533661

Hints

- The derivative at a point is the slope of the graph there. - Imagine a tangent line at \(x = 1\) in each panel. - A local maximum has derivative \(0\). - Compare the direction and steepness of the other three graphs.

Solution

1. Graph \(A\) is increasing steeply at \(x = 1\), with tangent slope \(2\). Thus, \(A\) matches (2). 2. Graph \(B\) has a local maximum at \(x = 1\), so its tangent is horizontal and the derivative is \(0\). Thus, \(B\) matches (1). 3. Graph \(C\) is increasing moderately at \(x = 1\), with tangent slope \(1\). Thus, \(C\) matches (4). 4. Graph \(D\) is decreasing steeply at \(x = 1\), with tangent slope \(-2\). Thus, \(D\) matches (3).

Answer

\(A\rightarrow (2)\) \(B\rightarrow (1)\) \(C\rightarrow (4)\) \(D\rightarrow (3)\)
53366212
The graph of \(f\) has marked points at \(x_1 = -2\), \(x_2 = 0\), and \(x_3 = 2\). Use the shown tangent lines to find the derivative at each x-value.
Figure for problem 533662

Hints

- The derivative is the slope of the tangent line. - A horizontal tangent has slope \(0\). - Choose readable grid points on each shown tangent line. - Check the sign of each slope.

Solution

1. At \(x_1 = -2\), the tangent line is horizontal. Therefore, \(f'(-2) = 0\). 2. At \(x_2 = 0\), the tangent line passes through \((0, 2)\) and \((1, 0)\). Its slope is \(\frac{0-2}{1-0} = -2\), so \(f'(0) = -2\). 3. At \(x_3 = 2\), the tangent line passes through \((1, 0)\) and \((2, -4)\). Its slope is \(\frac{-4-0}{2-1} = -4\), so \(f'(2) = -4\).

Answer

\(f'(-2) = 0\) \(f'(0) = -2\) \(f'(2) = -4\)
53366312
The graph of a function \(f\) is shown. Find the average rate of change of \(f\) on the intervals \([-5, 0]\) and \([0, 5]\). What do you notice when you compare the two results?
Figure for problem 533663

Hints

- Average rate of change is the slope of the secant line through the two endpoint points. - Use \(\frac{f(b)-f(a)}{b-a}\). - Check whether the graph rises or falls on each interval.

Solution

1. Read the endpoint values from the graph: \(f(-5) = 3\), \(f(0) = -2\), and \(f(5) = 3\). 2. On \([-5, 0]\), the average rate of change is \(\frac{f(0)-f(-5)}{0-(-5)} = \frac{-2-3}{5} = -1\). 3. On \([0, 5]\), the average rate of change is \(\frac{f(5)-f(0)}{5-0} = \frac{3-(-2)}{5} = 1\). 4. The rates have the same absolute value but opposite signs. This is consistent with the graph being symmetric about the y-axis: it decreases on the first interval and increases on the second.

Answer

On \([-5, 0]\), the average rate of change is \(-1\). On \([0, 5]\), it is \(1\). The rates have equal absolute values and opposite signs.
53366412
The figure shows the graph of a quadratic function \(f\). a) Find the average rate of change on \([-4, 4]\). b) Give another interval \([a, b]\), where \(a < b\), on which the average rate of change is also \(0\). Explain your choice.
Figure for problem 533664

Hints

- What must be true about the endpoint function values for the average rate of change to be \(0\)? - Look for symmetry in the graph. - Find two points on the graph with the same y-coordinate.

Solution

1. For part a, read the endpoint values from the graph: \(f(-4) = 2.4\) and \(f(4) = 2.4\). 2. The average rate of change is \(\frac{f(4)-f(-4)}{4-(-4)} = \frac{2.4-2.4}{8} = 0\). 3. For an average rate of change of \(0\), the endpoint function values must be equal. Because the graph is symmetric about the y-axis, any interval of the form \([-c, c]\) works within the shown domain. 4. One example is \([-2, 2]\), since \(f(-2) = f(2) = 3.6\).

Answer

a) \(0\) b) One possible interval is \([-2, 2]\). The endpoint function values are equal, so the secant line is horizontal.
53366612
The graph shows the water level in a rainwater collection basin over \(10\) hours. Find the average rate of change of the water level, in meters per hour, from \(t = 2\,\text{h}\) to \(t = 6\,\text{h}\). Interpret the sign of your result in context.
Figure for problem 533666

Hints

- Identify what each axis represents. - Average rate of change is change in water level divided by change in time. - In this context, what does a negative rate indicate?

Solution

1. Read the values from the graph: \(h(2) = 4.8\,\text{m}\) and \(h(6) = 3.2\,\text{m}\). 2. The average rate of change is \(\frac{h(6)-h(2)}{6-2} = \frac{3.2-4.8}{4} = \frac{-1.6}{4} = -0.4\,\frac{\text{m}}{\text{h}}\). 3. The negative sign means that the water level decreased over the interval. On average, it fell by \(0.4\,\text{m}\) each hour.

Answer

\(-0.4\,\frac{\text{m}}{\text{h}}\). The negative sign means the water level was decreasing during the interval.
53366712
Use the graph of \(f\) to find the average rate of change on each interval. Read the needed points directly from the coordinate plane. a) \([0, 2]\) b) \([-2, 0]\)
Figure for problem 533667

Hints

- Identify the two graph points at the endpoints of each interval. - Use the slope formula for the secant line. - Pay attention to the scale on each axis.

Solution

1. For \([0, 2]\), the graph gives \(f(0) = 4\) and \(f(2) = 2\). 2. The average rate of change is \(\frac{f(2)-f(0)}{2-0} = \frac{2-4}{2} = -1\). 3. For \([-2, 0]\), the graph gives \(f(-2) = 2\) and \(f(0) = 4\). 4. The average rate of change is \(\frac{f(0)-f(-2)}{0-(-2)} = \frac{4-2}{2} = 1\).

Answer

a) \(-1\) b) \(1\)
53366812
Use the graph of \(g\) to find the average rate of change on each interval. a) \([0, 2]\) b) \([1, 3]\)
Figure for problem 533668

Hints

- Average rate of change is the slope of the line through the two endpoint points. - Read the y-values at \(x = 0\), \(x = 1\), \(x = 2\), and \(x = 3\) carefully.

Solution

1. On \([0, 2]\), the graph gives the points \((0, 0)\) and \((2, 0)\). The average rate of change is \(\frac{0-0}{2-0} = 0\). 2. On \([1, 3]\), the graph gives \(g(1) = -0.75\) and \(g(3) = 3.75\). 3. The average rate of change is \(\frac{g(3)-g(1)}{3-1} = \frac{3.75-(-0.75)}{2} = \frac{4.5}{2} = 2.25\).

Answer

a) \(0\) b) \(2.25\)
53366912
The function \(h\) is defined by \(h(x) = 3x^2 - 6x + 2\). Find the average rate of change of \(h\) on each interval. Use the graph to illustrate your results. a) \([1, 3]\) b) \([-1, 1]\)
Figure for problem 533669

Hints

- Substitute each interval endpoint into the function to find the corresponding y-values. - Be careful with signs when substituting or subtracting negative numbers. - Use \(\frac{h(b)-h(a)}{b-a}\).

Solution

1. For \([1, 3]\), evaluate the endpoints: \(h(1) = 3(1)^2 - 6(1) + 2 = -1\) and \(h(3) = 3(3)^2 - 6(3) + 2 = 11\). 2. The average rate of change is \(\frac{h(3)-h(1)}{3-1} = \frac{11-(-1)}{2} = 6\). 3. For \([-1, 1]\), evaluate the endpoints: \(h(-1) = 3(-1)^2 - 6(-1) + 2 = 11\) and \(h(1) = -1\). 4. The average rate of change is \(\frac{h(1)-h(-1)}{1-(-1)} = \frac{-1-11}{2} = -6\).

Answer

a) \(6\) b) \(-6\)
53367012
The function \(k\) is defined by \(k(x) = -x^2 + 4x\). Find the average rate of change of \(k\) on each interval. What do you notice when you compare the results? a) \([0, 2]\) b) \([2, 4]\)
Figure for problem 533670

Hints

- First calculate \(k(0)\), \(k(2)\), and \(k(4)\). - Substitute the values into the average-rate-of-change formula. - Use the graph’s symmetry to explain the relationship between the answers.

Solution

1. Evaluate the needed values: \(k(0) = 0\), \(k(2) = 4\), and \(k(4) = 0\). 2. On \([0, 2]\), the average rate of change is \(\frac{k(2)-k(0)}{2-0} = \frac{4-0}{2} = 2\). 3. On \([2, 4]\), the average rate of change is \(\frac{k(4)-k(2)}{4-2} = \frac{0-4}{2} = -2\). 4. The rates have the same absolute value but opposite signs. The parabola is symmetric about \(x = 2\), increasing on the first interval and decreasing on the second.

Answer

a) \(2\) b) \(-2\) The rates have equal absolute values and opposite signs.
53367112
The graph of \(f\) includes tangent lines at \(x = -1\) and \(x = 2\). a) Use the tangent lines to find \(f'(-1)\) and \(f'(2)\). b) State whether \(f'(0)\), \(f'(3)\), and \(f'(-2)\) are positive, negative, or zero. c) Estimate \(f'(1)\) from the graph.
Figure for problem 533671

Hints

- Use rise divided by run on each drawn tangent line. - The derivative is positive where the graph rises and negative where it falls. - At a local maximum or minimum, the tangent is horizontal. - Estimate an undrawn tangent from the local direction of the curve.

Solution

1. At \(x = -1\), the tangent rises \(1\) unit for each \(1\) unit of run, so \(f'(-1) = 1\). 2. At \(x = 2\), the tangent falls \(2\) units for each \(1\) unit of run, so \(f'(2) = -2\). 3. At \(x = 0\), the graph has a maximum, so \(f'(0) = 0\). 4. The graph is decreasing at \(x = 3\), so \(f'(3)<0\). It is increasing at \(x = -2\), so \(f'(-2)>0\). 5. Near \(x = 1\), the graph falls about \(1\) unit for each \(1\) unit of run, so \(f'(1)\approx -1\).

Answer

a) \(f'(-1) = 1\) and \(f'(2) = -2\) b) \(f'(0) = 0\), \(f'(3)<0\), and \(f'(-2)>0\) c) \(f'(1)\approx -1\)
53367312
The graph of \(f\) and two tangent lines are shown. a) Use the drawn tangent lines to find \(f'(1)\) and \(f'(-2)\). b) Estimate the tangent-line slopes at \(A(2, 0)\) and \(B(0, -2)\).
Figure for problem 533673

Hints

- A derivative value equals the slope of the tangent line. - Use two readable points on each drawn tangent. - Estimate the direction and steepness of the graph at \(A\). - A tangent at a minimum is horizontal.

Solution

1. The tangent at \(x = 1\) passes through \((1, -1.5)\) and \((2.5, 0)\). Its slope is \(\frac{0-(-1.5)}{2.5-1} = 1\), so \(f'(1) = 1\). 2. The tangent at \(x = -2\) passes through \((-2, 0)\) and \((-1, -2)\). Its slope is \(\frac{-2-0}{-1-(-2)} = -2\), so \(f'(-2) = -2\). 3. At \(A(2, 0)\), the graph rises about \(2\) units for each unit of run, so the slope is \(\approx 2\). 4. Point \(B(0, -2)\) is a minimum, so its tangent is horizontal and the slope is \(0\).

Answer

a) \(f'(1) = 1\) and \(f'(-2) = -2\) b) At \(A\): \(\approx 2\); at \(B\): \(0\)
53371312
A tank is being filled with water. The graph shows the water height \(h\), in inches, as a function of time \(t\), in minutes. Find the average rate of change on each interval. a) \([0, 5]\) b) \([5, 15]\) c) \([0, 15]\)
Figure for problem 533713

Hints

- The average rate tells how many inches the water height rises per minute, on average. - Identify the graph points at the endpoints of each interval. - Include the correct units in each answer.

Solution

1. Read the graph values: \(h(0) = 0\), \(h(5) = 5\), and \(h(15) = 10\). 2. On \([0, 5]\), the average rate is \(\frac{5-0}{5-0} = 1\,\frac{\text{in.}}{\text{min}}\). 3. On \([5, 15]\), the average rate is \(\frac{10-5}{15-5} = \frac{5}{10} = 0.5\,\frac{\text{in.}}{\text{min}}\). 4. On \([0, 15]\), the average rate is \(\frac{10-0}{15-0} = \frac{2}{3}\,\frac{\text{in.}}{\text{min}} \approx 0.67\,\frac{\text{in.}}{\text{min}}\).

Answer

a) \(1\,\frac{\text{in.}}{\text{min}}\) b) \(0.5\,\frac{\text{in.}}{\text{min}}\) c) \(\frac{2}{3}\,\frac{\text{in.}}{\text{min}} \approx 0.67\,\frac{\text{in.}}{\text{min}}\)
53371512
Use the drawn tangent lines to find the derivative of \(f\) at \(x_1 = 0\), \(x_2 = 2\), and \(x_3 = 4\).
Figure for problem 533715

Hints

- The derivative at a point is the slope of the tangent line. - Use two grid points to calculate each slope. - A horizontal line has slope \(0\).

Solution

1. At \(x = 0\), the tangent passes through \((0, 1)\) and \((1, 3)\). Its slope is \(\frac{3-1}{1-0} = 2\), so \(f'(0) = 2\). 2. At \(x = 2\), the tangent is horizontal, so \(f'(2) = 0\). 3. At \(x = 4\), the tangent passes through \((4, 1)\) and \((5, -1)\). Its slope is \(\frac{-1-1}{5-4} = -2\), so \(f'(4) = -2\).

Answer

\(f'(0) = 2\), \(f'(2) = 0\), and \(f'(4) = -2\)
53371612
The graph of \(g\) includes tangent lines at points \(A\), \(B\), and \(C\). Find \(g'(-2)\), \(g'(0)\), and \(g'(2)\).
Figure for problem 533716

Hints

- The derivative equals the tangent-line slope. - Horizontal tangent lines have slope \(0\). - Use two readable grid points on the tangent at \(B\).

Solution

1. At \(A(-2, 4)\), the tangent line is horizontal, so \(g'(-2) = 0\). 2. At \(B(0, 0)\), the tangent passes through \((0, 0)\) and \((1, -3)\). Its slope is \(\frac{-3-0}{1-0} = -3\), so \(g'(0) = -3\). 3. At \(C(2, -4)\), the tangent line is horizontal, so \(g'(2) = 0\).

Answer

\(g'(-2) = 0\), \(g'(0) = -3\), and \(g'(2) = 0\)
53371712
Use the graph of \(h\) to find the average rate of change on each interval. a) \([0, 2]\) b) \([2, 4]\) c) \([0, 4]\)
Figure for problem 533717

Hints

- Average rate of change is the slope of the secant line through the endpoint points. - Read the y-values at the given x-values first. - Use \(\frac{y_2-y_1}{x_2-x_1}\).

Solution

1. Read the graph values: \(h(0) = 0\), \(h(2) = -2\), and \(h(4) = 0\). 2. On \([0, 2]\), the average rate of change is \(\frac{h(2)-h(0)}{2-0} = \frac{-2-0}{2} = -1\). 3. On \([2, 4]\), the average rate of change is \(\frac{h(4)-h(2)}{4-2} = \frac{0-(-2)}{2} = 1\). 4. On \([0, 4]\), the average rate of change is \(\frac{h(4)-h(0)}{4-0} = \frac{0-0}{4} = 0\).

Answer

a) \(-1\) b) \(1\) c) \(0\)
53371812
The figure shows the graph of a periodic function \(k\). Find the average rate of change of \(k\) on each interval. a) \([0, 2]\) b) \([0, 4]\) c) \([2, 6]\)
Figure for problem 533718

Hints

- Average rate of change is the slope of the line through the two endpoint points. - Pay attention to the scale on each axis. - A rate of \(0\) means the endpoint function values are equal, not necessarily that the graph is constant between them.

Solution

1. Read the graph values: \(k(0) = 0\), \(k(2) = 2\), \(k(4) = 0\), and \(k(6) = -2\). 2. On \([0, 2]\), the average rate of change is \(\frac{k(2)-k(0)}{2-0} = \frac{2-0}{2} = 1\). 3. On \([0, 4]\), the average rate of change is \(\frac{k(4)-k(0)}{4-0} = \frac{0-0}{4} = 0\). 4. On \([2, 6]\), the average rate of change is \(\frac{k(6)-k(2)}{6-2} = \frac{-2-2}{4} = -1\).

Answer

a) \(1\) b) \(0\) c) \(-1\)
53390712
Use the tangent line in the graph to find the instantaneous rate of change of \(g\) at point \(P\).
Figure for problem 533907

Hints

- Instantaneous rate of change is the tangent-line slope. - Choose two easy-to-read points on the line labeled \(t\).

Solution

1. Choose two points on the tangent line, such as \((1, 3)\) and \((3, 1)\). 2. The change in \(y\) is \(1-3 = -2\), and the change in \(x\) is \(3-1 = 2\). 3. The tangent slope is \(\frac{-2}{2} = -1\). Therefore, the instantaneous rate of change at \(P\) is \(-1\).

Answer

The instantaneous rate of change is \(-1\).
53390812
Find the slope of the graph of \(h\) at \(P(4, 2)\) using the tangent line.
Figure for problem 533908

Hints

- Use the tangent line's y-intercept and point \(P\) as two easy-to-read points. - Compare the vertical change with the horizontal change.

Solution

1. Two points on the tangent line are \((0, 1)\) and \(P(4, 2)\). 2. The rise is \(2-1 = 1\), and the run is \(4-0 = 4\). 3. The slope is \(\frac{1}{4} = 0.25\).

Answer

The slope is \(0.25\).
53391112
Use the given axis scale and tangent line to find the slope of the function at point \(P\).
Figure for problem 533911

Hints

- The large axis values do not change the slope formula. - Check how much each grid interval represents on both axes. - Use rise divided by run.

Solution

1. Two readable points on the tangent line are \((25, 0)\) and \((75, 50)\). 2. The rise is \(50-0 = 50\), and the run is \(75-25 = 50\). 3. The slope is \(\frac{50}{50} = 1\).

Answer

The slope is \(1\).
53392812
The graph of \(g\) has marked points \(A\), \(B\), and \(C\). At which point is the derivative value smallest? Justify your answer by comparing tangent slopes.
Figure for problem 533928

Hints

- Imagine the tangent line at each marked point. - Relate increasing, decreasing, and horizontal behavior to the sign of slope. - Compare a negative value, zero, and a positive value.

Solution

1. At \(A\), the graph is decreasing, so the tangent slope and derivative are negative. 2. At \(B\), the graph has a minimum, so the tangent is horizontal and the derivative is \(0\). 3. At \(C\), the graph is increasing, so the tangent slope and derivative are positive. 4. A negative number is less than \(0\) and less than a positive number, so the derivative is smallest at \(A\).

Answer

The derivative is smallest at \(A\), where the graph has a negative tangent slope.
53413312
A hot-air balloon rises and later descends. The function \(h\) gives its height above the ground, in meters, as a function of time \(t\), in minutes. Find the balloon’s average rate of change in height on each interval. a) \([0, 1]\) b) \([1, 4]\)
Figure for problem 534133

Hints

- Average rate of change is the slope of a secant line. - Read the height at each interval endpoint. - What does a negative rate mean for the balloon’s motion? - Use \(\frac{h(b)-h(a)}{b-a}\).

Solution

1. Read the values from the graph: \(h(0) = 100\,\text{m}\), \(h(1) = 160\,\text{m}\), and \(h(4) = 100\,\text{m}\). 2. On \([0, 1]\), the average rate of change is \(\frac{h(1)-h(0)}{1-0} = \frac{160-100}{1} = 60\,\frac{\text{m}}{\text{min}}\). 3. On \([1, 4]\), the average rate of change is \(\frac{h(4)-h(1)}{4-1} = \frac{100-160}{3} = -20\,\frac{\text{m}}{\text{min}}\). The negative sign indicates descent.

Answer

a) \(60\,\frac{\text{m}}{\text{min}}\) b) \(-20\,\frac{\text{m}}{\text{min}}\); the balloon descends at an average rate of \(20\,\frac{\text{m}}{\text{min}}\).
53414112
The graph of \(V\) shows the volume of water in a storage tank, in liters, as a function of time \(t\), in minutes. Find the average rate of change of the volume on \([2, 8]\). Include the correct units and interpret the result in context.
Figure for problem 534141

Hints

- Read \(V(2)\) and \(V(8)\) from the graph. - Average rate of change is the slope of the secant line. - Divide a change in volume by a change in time. - Interpret the sign and units in context.

Solution

1. Read the endpoint values from the graph: \(V(2) = 10\,\text{L}\) and \(V(8) = 16\,\text{L}\). 2. The average rate of change is \(\frac{V(8)-V(2)}{8-2} = \frac{16-10}{6} = 1\,\frac{\text{L}}{\text{min}}\). 3. Over this interval, the volume increased by an average of \(1\) liter per minute.

Answer

\(1\,\frac{\text{L}}{\text{min}}\). The tank’s water volume increased by an average of \(1\) liter per minute.
53414612
The graph of a function \(f\) is shown. a) Find the average rate of change of \(f\) on \([0, 1]\) and on \([-2, 0]\). b) Give an interval on which the average rate of change is \(0\).
Figure for problem 534146

Hints

- Interpret average rate of change as the slope of a secant line. - Read the function values at the interval endpoints. - When is a secant line horizontal? - Look for two graph points with the same y-coordinate.

Solution

1. Read the graph values: \(f(0) = 4\), \(f(1) = 3\), and \(f(-2) = 0\). 2. On \([0, 1]\), the average rate of change is \(\frac{f(1)-f(0)}{1-0} = \frac{3-4}{1} = -1\). 3. On \([-2, 0]\), the average rate of change is \(\frac{f(0)-f(-2)}{0-(-2)} = \frac{4-0}{2} = 2\). 4. An average rate of change of \(0\) occurs when the endpoint function values are equal. For example, \(f(-1) = f(1) = 3\), so \([-1, 1]\) works.

Answer

a) On \([0, 1]\): \(-1\); on \([-2, 0]\): \(2\) b) One possible interval is \([-1, 1]\).
53414712
The graph of a function \(g\) is shown. a) Find the average rate of change on \([-1, 1]\) and on \([1, 2]\). b) Give an interval on which the average rate of change is \(0\).
Figure for problem 534147

Hints

- Average rate of change is the slope of the secant line through two graph points. - Read the y-values at the given x-values carefully. - Use \(\frac{y_2-y_1}{x_2-x_1}\). - For a rate of \(0\), find two points with the same y-coordinate.

Solution

1. Read the graph values: \(g(-1) = 2\), \(g(1) = -2\), and \(g(2) = 2\). 2. On \([-1, 1]\), the average rate of change is \(\frac{g(1)-g(-1)}{1-(-1)} = \frac{-2-2}{2} = -2\). 3. On \([1, 2]\), the average rate of change is \(\frac{g(2)-g(1)}{2-1} = \frac{2-(-2)}{1} = 4\). 4. For an average rate of change of \(0\), the endpoint function values must be equal. Since \(g(-2) = g(1) = -2\), the interval \([-2, 1]\) works.

Answer

a) On \([-1, 1]\): \(-2\); on \([1, 2]\): \(4\) b) One possible interval is \([-2, 1]\).
53414912
Consider the function \(g(x) = \frac{6}{x}\) for \(x > 0\). Find the average rate of change on \([1, 3]\) and on \([2, 5]\).
Figure for problem 534149

Hints

- As \(x\) increases, what happens to the values of this function? What does that suggest about the sign of the rate? - Evaluate the function at each interval endpoint. - Divide the change in the function value by the change in \(x\).

Solution

1. Evaluate the needed values: \(g(1) = 6\), \(g(3) = 2\), \(g(2) = 3\), and \(g(5) = \frac{6}{5} = 1.2\). 2. On \([1, 3]\), the average rate of change is \(\frac{g(3)-g(1)}{3-1} = \frac{2-6}{2} = -2\). 3. On \([2, 5]\), the average rate of change is \(\frac{g(5)-g(2)}{5-2} = \frac{1.2-3}{3} = -0.6\).

Answer

On \([1, 3]\): \(-2\) On \([2, 5]\): \(-0.6\)
53415012
A cup of hot tea cools over time. The graph shows the temperature \(T\), in degrees Fahrenheit, as a function of time \(t\), in minutes. Find the average rate of change of the temperature on each interval. a) \([0, 20]\) b) \([20, 40]\)
Figure for problem 534150

Hints

- Read the temperature at the beginning and end of each interval. - Calculate the slope of the secant line through those two points. - The units are degrees Fahrenheit per minute. - What does the negative sign mean for the tea’s temperature?

Solution

1. On \([0, 20]\), read \(T(0) = 140\,{}^\circ\text{F}\) and \(T(20) = 104\,{}^\circ\text{F}\). The average rate of change is \(\frac{104-140}{20-0} = -1.8\,\frac{{}^\circ\text{F}}{\text{min}}\). 2. On \([20, 40]\), read \(T(20) = 104\,{}^\circ\text{F}\) and \(T(40) = 86\,{}^\circ\text{F}\). The average rate of change is \(\frac{86-104}{40-20} = -0.9\,\frac{{}^\circ\text{F}}{\text{min}}\). 3. The tea cools faster during the first interval because the first rate has the greater absolute value.

Answer

a) \(-1.8\,\frac{{}^\circ\text{F}}{\text{min}}\) b) \(-0.9\,\frac{{}^\circ\text{F}}{\text{min}}\)
53415112
A sunflower’s growth was tracked for \(20\) weeks. The graph shows its height \(h\), in inches, as a function of time \(t\), in weeks. Find the average growth rate during each period. a) The first \(10\) weeks, \([0, 10]\) b) The next \(10\) weeks, \([10, 20]\)
Figure for problem 534151

Hints

- Read the plant’s height at \(t = 0\), \(t = 10\), and \(t = 20\). - Find the change in height over each period. - Divide the height change by the number of weeks. - Include the units inches per week.

Solution

1. On \([0, 10]\), read \(h(0) = 20\,\text{in.}\) and \(h(10) = 80\,\text{in.}\). The average growth rate is \(\frac{80-20}{10-0} = 6\,\frac{\text{in.}}{\text{week}}\). 2. On \([10, 20]\), read \(h(10) = 80\,\text{in.}\) and \(h(20) = 100\,\text{in.}\). The average growth rate is \(\frac{100-80}{20-10} = 2\,\frac{\text{in.}}{\text{week}}\). 3. The sunflower grew faster, on average, during the first \(10\) weeks.

Answer

a) \(6\,\frac{\text{in.}}{\text{week}}\) b) \(2\,\frac{\text{in.}}{\text{week}}\)
53415812
A tangent line is drawn to the graph of \(f\) at \(x = 0\). Find \(f'(0)\).
Figure for problem 534158

Hints

- A line through the origin makes the slope calculation direct. - Check whether the tangent rises or falls from left to right. - Use rise divided by run.

Solution

1. The derivative \(f'(0)\) equals the slope of the tangent line through the origin. 2. The tangent line passes through \((0, 0)\) and \((1, -1)\). 3. Its slope is \(\frac{-1-0}{1-0} = -1\). 4. Therefore, \(f'(0) = -1\).

Answer

\(f'(0) = -1\)
53415912
Use the graph to determine the instantaneous rate of change of \(f\) at \(x_0=2\).
Figure for problem 534159

Hints

- The derivative at a point equals the slope of the tangent line there. - Read two clear points on the tangent, paying attention to the axis scales.

Solution

1. The instantaneous rate of change is the slope of the tangent line at \(x=2\). 2. Two points on the tangent are \((2, 1)\) and \((4, 0)\). 3. The slope is \(\frac{0-1}{4-2}=-\frac{1}{2}=-0.5\).

Answer

\(f^{\prime}(2)=-0.5\)
53416012
The graph shows a square-root function \(f\). Find \(f^{\prime}(x_0)\) at the marked point.
Figure for problem 534160

Hints

- Use the tangent line to determine the slope at the marked point. - Choose two clear grid points on the tangent that are reasonably far apart.

Solution

1. The derivative is the slope of the tangent line. 2. Two points on the tangent are \((1, 2)\) and \((2, 3)\). 3. Therefore, the slope is \(\frac{3-2}{2-1}=1\).

Answer

\(f^{\prime}(x_0)=1\)
53416112
Use the graph and its tangent line to find \(f'(-2)\).
Figure for problem 534161

Hints

- Pay close attention to signs when using negative x-coordinates. - A line that falls from left to right has negative slope. - Use rise divided by run.

Solution

1. The derivative \(f'(-2)\) equals the slope of the tangent line at \((-2, 0)\). 2. Two points on the tangent line are \((-2, 0)\) and \((-3, 2)\). 3. The slope is \(\frac{2-0}{-3-(-2)} = -2\). 4. Therefore, \(f'(-2) = -2\).

Answer

\(f'(-2) = -2\)
53416212
The function is \(f(x)=x^2-4x+5\). Use the drawn tangent to determine \(f^{\prime}(1)\) graphically.
Figure for problem 534162

Hints

- Find two integer-coordinate points on the tangent line. - Since the tangent decreases from left to right, its slope must be negative.

Solution

1. The derivative at \(x=1\) is the slope of the tangent at \((1, 2)\). 2. The tangent also passes through \((2, 0)\). 3. Its slope is \(\frac{0-2}{2-1}=-2\).

Answer

\(f^{\prime}(1)=-2\)
53417112
A small ball rolls down a model track. The track’s vertical profile is approximated by \(h(x) = -0.2x^2 + 5\), where \(x\) is the horizontal distance from the start and \(h(x)\) is the height above the floor, both in feet. Find the average slope of the track from \(x = 1\) to \(x = 4\). Interpret the value and its sign in context.
Figure for problem 534171

Hints

- How do you calculate the average slope between two points? - Find the height at each given x-value first. - Use the difference quotient for the two endpoint points. - What does a negative slope mean for the direction of the track?

Solution

1. Evaluate the endpoint heights: \(h(1) = -0.2(1)^2+5 = 4.8\,\text{ft}\) and \(h(4) = -0.2(4)^2+5 = 1.8\,\text{ft}\). 2. The average slope is \(\frac{h(4)-h(1)}{4-1} = \frac{1.8-4.8}{3} = -1\). 3. The negative sign means the track descends. On average, the height drops \(1\) foot for every \(1\) foot of horizontal distance over this section.

Answer

The average slope is \(-1\). The track drops an average of \(1\) foot vertically for each \(1\) foot of horizontal distance.
53418612
A remote-controlled car starts from rest, reaches a maximum speed, and then slows to a stop. The graph shows velocity \(v\) as a function of time \(t\). a) Use the drawn tangent lines to find the instantaneous rate of change of velocity at \(t = 0\) and \(t = 20\) seconds. b) When is the instantaneous rate zero? What is true about the velocity at that time? c) What is the physics term for the instantaneous rate of change of velocity?
Figure for problem 534186

Hints

- Use the drawn tangent slopes at the endpoints. - A horizontal tangent has slope \(0\). - The highest point of a velocity graph represents maximum velocity. - Recall the physics term for change in velocity per unit time.

Solution

1. At \(t = 0\), the tangent passes through \((0, 0)\) and \((4, 4)\), giving slope \(1\,\frac{\text{m}}{\text{s}^2}\). 2. At \(t = 20\), the tangent through \((16, 4)\) and \((20, 0)\) has slope \(-1\,\frac{\text{m}}{\text{s}^2}\). 3. The rate is zero at the vertex, \(t = 10\) seconds, because the tangent is horizontal. The velocity is then at its maximum value of \(5\,\frac{\text{m}}{\text{s}}\). 4. The instantaneous rate of change of velocity is acceleration. A negative value indicates deceleration.

Answer

a) At \(t = 0\): \(1\,\frac{\text{m}}{\text{s}^2}\); at \(t = 20\): \(-1\,\frac{\text{m}}{\text{s}^2}\) b) At \(t = 10\,\text{s}\); the velocity is maximal at \(5\,\frac{\text{m}}{\text{s}}\). c) Acceleration
53424612
The graph of a function \(g\) is shown. Find the average rate of change of \(g\) on each interval. a) \([1, 3]\) b) \([-2, 0]\)
Figure for problem 534246

Hints

- Locate the graph points at the endpoints of each interval. - Average rate of change is the slope of the secant line through those points. - Use \(\frac{y_2-y_1}{x_2-x_1}\). - Be careful when subtracting negative function values.

Solution

1. On \([1, 3]\), read \(g(1) = -2\) and \(g(3) = 4\). The average rate of change is \(\frac{g(3)-g(1)}{3-1} = \frac{4-(-2)}{2} = 3\). 2. On \([-2, 0]\), read \(g(-2) = 4\) and \(g(0) = 1\). The average rate of change is \(\frac{g(0)-g(-2)}{0-(-2)} = \frac{1-4}{2} = -1.5\).

Answer

a) \(3\) b) \(-1.5\)
53425012
The distance-time graph shows an eight-hour hike. The variable \(t\) is time in hours, and \(s\) is distance traveled in miles. 1. Find the hiker’s average speed for the entire hike. 2. During which interval, \([0, 4]\) or \([4, 8]\), was the hiker faster on average? Justify your answer using the graph. 3. Explain what the slope of the secant line through \(P(0, 0)\) and \(Q(8, 14)\) means in context.
Figure for problem 534250

Hints

- Speed is distance divided by time. - Compare the distance gained during each four-hour interval. - A steeper distance-time graph indicates a greater average speed. - A secant line through the first and last points represents an average over the full interval.

Solution

1. For the entire hike, the average speed is \(\frac{14\,\text{mi}}{8\,\text{h}} = 1.75\,\text{mph}\). 2. On \([0, 4]\), the hiker travels \(8\) miles, so the average speed is \(\frac{8}{4} = 2\,\text{mph}\). On \([4, 8]\), the hiker travels \(14-8 = 6\) miles, so the average speed is \(\frac{6}{4} = 1.5\,\text{mph}\). The hiker was faster on average during \([0, 4]\), which also appears as the steeper portion of the distance-time graph. 3. The secant slope through the start and end points is the average speed for the entire hike, \(1.75\,\text{mph}\).

Answer

1. \(1.75\,\text{mph}\) 2. \([0, 4]\); the average speeds are \(2\,\text{mph}\) and \(1.5\,\text{mph}\), respectively. 3. The secant slope represents the hiker’s average speed over all eight hours.
53503412
The graph shows a function \(f\) and tangent line \(t\) at point \(P(2, 4)\). Find \(f'(2)\) by reading the slope of the tangent line from the graph.
Figure for problem 535034

Hints

- Recall how the slope of a tangent line is related to the derivative at the point of tangency. - Compare the rise and run between two grid points on the tangent line. - Choose two points on the line that lie exactly on grid intersections.

Solution

1. Point \(P(2, 4)\) is the point of tangency. 2. Two convenient points on tangent line \(t\) are \((1, 3)\) and \((2, 4)\). 3. The tangent slope is \(m = \frac{4-3}{2-1} = 1\). 4. The derivative equals the tangent slope at the point, so \(f'(2) = 1\).

Answer

\(f'(2) = 1\)
52214812
A water tank is being drained. The volume of water remaining, in liters, is modeled by \(V(t) = 0.5t^2 - 20t + 200\) for \(0 \le t \le 20\), where \(t\) is the number of minutes since the drain was opened. a) Find the average rate of change of the volume during the first 10 minutes, \([0, 10]\), and during the second half of the draining process, \([10, 20]\). b) Compare the two values and explain what they mean for the rate at which water leaves the tank.

Hints

- How do you find the slope between two points on a curve? - Track the units: volume changes over a time interval. - What does comparing the magnitudes of the two rates tell you about how quickly the process occurs? - As the amount of water in the tank decreases, what might happen to the outflow rate?

Solution

1. Evaluate the volume at the interval endpoints: \(V(0) = 200\), \(V(10) = 0.5 \cdot 10^2 - 20 \cdot 10 + 200 = 50\), and \(V(20) = 0.5 \cdot 20^2 - 20 \cdot 20 + 200 = 0\). 2. Over \([0, 10]\), the average rate of change is \(\frac{V(10) - V(0)}{10 - 0} = \frac{50 - 200}{10} = -15\,\frac{\text{L}}{\text{min}}\). 3. Over \([10, 20]\), the average rate of change is \(\frac{V(20) - V(10)}{20 - 10} = \frac{0 - 50}{10} = -5\,\frac{\text{L}}{\text{min}}\). 4. The volume decreases by an average of \(15\,\frac{\text{L}}{\text{min}}\) in the first interval but only \(5\,\frac{\text{L}}{\text{min}}\) in the second. The smaller magnitude means the tank drains more slowly later in the process.

Answer

a) Over \([0, 10]\), \(-15\,\frac{\text{L}}{\text{min}}\); over \([10, 20]\), \(-5\,\frac{\text{L}}{\text{min}}\). b) The outflow rate decreases in magnitude. On average, \(15\) liters per minute leave the tank during the first half, compared with \(5\) liters per minute during the second half.
52215112
Let \(f(x) = \frac{6}{x - 2}\). State the domain of \(f\). Then find the average rate of change of \(f\) over \(I_1 = [-4, -1]\), \(I_2 = [-1, 1]\), and \(I_3 = [-4, 1]\).

Hints

- Which input would make the denominator equal to zero? - How do you find the slope of a secant line through two points on a graph? - Which function values must you calculate before applying the average-rate-of-change formula?

Solution

1. The denominator cannot equal zero: \(x - 2 \ne 0\), so \(x \ne 2\). Therefore, the domain is \(\mathbb{R} \setminus \{2\}\). 2. Evaluate the endpoint values: \(f(-4) = \frac{6}{-4 - 2} = -1\), \(f(-1) = \frac{6}{-1 - 2} = -2\), and \(f(1) = \frac{6}{1 - 2} = -6\). 3. Over \(I_1\), \(\frac{f(-1) - f(-4)}{-1 - (-4)} = \frac{-2 - (-1)}{3} = -\frac{1}{3}\). 4. Over \(I_2\), \(\frac{f(1) - f(-1)}{1 - (-1)} = \frac{-6 - (-2)}{2} = -2\). 5. Over \(I_3\), \(\frac{f(1) - f(-4)}{1 - (-4)} = \frac{-6 - (-1)}{5} = -1\).

Answer

\(D_f\): \(\mathbb{R} \setminus \{2\}\) \(I_1\): \(-\frac{1}{3}\) \(I_2\): \(-2\) \(I_3\): \(-1\)
52215212
Let \(f(x) = \sqrt{x + 1}\). State the domain of \(f\). Then find the average rate of change of \(f\) over \(I_1 = [0, 3]\), \(I_2 = [3, 8]\), and \(I_3 = [0, 8]\).

Hints

- What condition must the expression under a square root satisfy? - Recall the difference quotient \(\frac{f(b) - f(a)}{b - a}\). - First write the function values at \(x = 0\), \(x = 3\), and \(x = 8\).

Solution

1. The radicand must be nonnegative: \(x + 1 \ge 0\), so \(x \ge -1\). Therefore, the domain is \([-1, \infty)\). 2. Evaluate the endpoint values: \(f(0) = 1\), \(f(3) = 2\), and \(f(8) = 3\). 3. Over \(I_1\), \(\frac{f(3) - f(0)}{3 - 0} = \frac{2 - 1}{3} = \frac{1}{3}\). 4. Over \(I_2\), \(\frac{f(8) - f(3)}{8 - 3} = \frac{3 - 2}{5} = \frac{1}{5} = 0.2\). 5. Over \(I_3\), \(\frac{f(8) - f(0)}{8 - 0} = \frac{3 - 1}{8} = \frac{1}{4} = 0.25\).

Answer

\(D_f\): \([-1, \infty)\) \(I_1\): \(\frac{1}{3}\) \(I_2\): \(\frac{1}{5} = 0.2\) \(I_3\): \(\frac{1}{4} = 0.25\)
52215312
An initial deposit of \(\$1000\) is placed in a savings account that earns \(4\%\) interest compounded annually. a) Write a function \(K(t)\) that gives the account balance, in dollars, after \(t\) years. b) Find the average rate of change of the balance over each interval: (1) \(I_1 = [0, 10]\) (2) \(I_2 = [20, 30]\) c) Interpret the values in context. Explain why they differ even though the interest rate stays the same.

Hints

- How does a quantity change over time under constant percent growth? - What calculation represents the average change over an interval? - What does the slope of a secant line through two points represent? - What units should the average rate have?

Solution

1. The annual growth factor is \(1.04\), so \(K(t) = 1000 \cdot 1.04^t\). 2. Over \(I_1\), \(K(0) = 1000\) and \(K(10) = 1000 \cdot 1.04^{10} \approx 1480.24\). Thus, \(\frac{K(10) - K(0)}{10 - 0} \approx \frac{1480.24 - 1000}{10} \approx 48.02\,\frac{\text{dollars}}{\text{year}}\). 3. Over \(I_2\), \(K(20) = 1000 \cdot 1.04^{20} \approx 2191.12\) and \(K(30) = 1000 \cdot 1.04^{30} \approx 3243.40\). Thus, \(\frac{K(30) - K(20)}{30 - 20} \approx \frac{3243.40 - 2191.12}{10} \approx 105.23\,\frac{\text{dollars}}{\text{year}}\). 4. Each value is the average annual increase in dollars during that interval. Compound interest applies the same percentage to a larger balance in later years, so the later absolute increase is greater.

Answer

a) \(K(t) = 1000 \cdot 1.04^t\) b) (1) Approximately \(\$48.02\) per year (2) Approximately \(\$105.23\) per year c) The values are average annual increases in dollars. Because the account balance grows over time, the same \(4\%\) rate produces larger dollar increases in later years.
52215412
After a medication is taken, the concentration of its active ingredient in the blood decreases. The concentration, in milligrams per liter, is modeled by \(C(t) = 200 \cdot 0.8^t\), where \(t\) is the number of hours since the medication was taken. a) Find the average rate of change of the concentration over \(I_1 = [0, 2]\) and \(I_2 = [4, 6]\). b) Interpret the sign of each result in context. c) Compare the magnitudes of the two rates and explain the difference in terms of the decay process.

Hints

- Recall the difference-quotient formula. - What does a negative rate of change say about the graph? - Compare the absolute amounts lost during the two intervals. - Does the amount lost depend on how much is still present?

Solution

1. Over \(I_1\), \(C(0) = 200\) and \(C(2) = 200 \cdot 0.8^2 = 128\). Therefore, \(\frac{C(2) - C(0)}{2 - 0} = \frac{128 - 200}{2} = -36\,\frac{\text{mg}}{\text{L} \cdot \text{h}}\). 2. Over \(I_2\), \(C(4) = 200 \cdot 0.8^4 = 81.92\) and \(C(6) = 200 \cdot 0.8^6 \approx 52.43\). Therefore, \(\frac{C(6) - C(4)}{6 - 4} \approx \frac{52.43 - 81.92}{2} \approx -14.75\,\frac{\text{mg}}{\text{L} \cdot \text{h}}\). 3. The negative signs indicate that the concentration decreases over time. 4. The first rate has greater magnitude because exponential decay removes a fixed percentage of the amount present. More of the active ingredient is present at the beginning, so the absolute decrease per hour is larger then.

Answer

a) \(I_1\): \(-36\,\frac{\text{mg}}{\text{L} \cdot \text{h}}\) \(I_2\): Approximately \(-14.75\,\frac{\text{mg}}{\text{L} \cdot \text{h}}\) b) Each negative sign indicates that the concentration is decreasing. c) The concentration decreases faster in absolute terms during \(I_1\). Because \(20\%\) of the remaining concentration is lost each hour, the amount lost per hour becomes smaller as the concentration decreases.
52215512
A weather balloon rises through the atmosphere. From \(t_1 = 12\,\text{min}\) to \(t_2 = 28\,\text{min}\) after launch, its average upward velocity is \(3.5\,\frac{\text{m}}{\text{s}}\). At time \(t_2\), the balloon is \(7450\,\text{m}\) above the ground. a) Find the height of the balloon at time \(t_1\). b) Interpret the average upward velocity geometrically on a height-versus-time graph. Explain why the height at \(t = 20\,\text{min}\) cannot be determined exactly without knowing a function for the balloon’s height.

Hints

- Convert all time measurements to the same unit before using the velocity. - What does a difference quotient represent graphically when two points on a graph are connected? - Must an object move at its average velocity at every instant in the interval?

Solution

1. Convert the elapsed time to seconds: \(\Delta t = (28 - 12) \cdot 60 = 960\,\text{s}\). 2. Find the change in height: \(\Delta h = 3.5\,\frac{\text{m}}{\text{s}} \cdot 960\,\text{s} = 3360\,\text{m}\). 3. Subtract this change from the final height: \(h(t_1) = 7450 - 3360 = 4090\,\text{m}\). 4. Geometrically, the average upward velocity is the slope of the secant line through the two measured points. If time is measured in minutes on the graph, the secant slope is \(210\,\frac{\text{m}}{\text{min}}\), equivalent to \(3.5\,\frac{\text{m}}{\text{s}}\). 5. An average velocity does not require the velocity to be constant. Without the actual height function, the path of the graph between the two endpoints is unknown, so the height at \(20\) minutes cannot be determined exactly.

Answer

a) \(4090\,\text{m}\) b) The average upward velocity is the slope of the secant line through the two endpoint measurements. With time measured in minutes, that slope is \(210\,\frac{\text{m}}{\text{min}}\). The balloon’s velocity may vary between the endpoints, so its height at \(20\) minutes cannot be found from the average velocity alone.
52215612
In a chemistry experiment, a liquid cools over time. The temperature is described by a function \(T\), where \(t\) is the number of minutes since the experiment began. From \(t = 5\,\text{min}\) to \(t = 15\,\text{min}\), the average rate of change of the temperature is \(-1.8\,\frac{\text{K}}{\text{min}}\). After \(15\) minutes, the temperature is \(42.5\,^\circ\text{C}\). a) Find the temperature at \(t = 5\,\text{min}\). b) Write the difference quotient for \([5, 15]\) and explain how its meaning differs from the instantaneous rate of change \(T'(10)\).

Hints

- How are average rate of change, elapsed time, and total change related? - Recall the definition of a difference quotient. - What is the graphical difference between a secant line and a tangent line?

Solution

1. The time interval has length \(15 - 5 = 10\,\text{min}\). 2. The total temperature change is \(\Delta T = -1.8\,\frac{\text{K}}{\text{min}} \cdot 10\,\text{min} = -18\,\text{K}\). 3. Therefore, \(T(5) = T(15) - \Delta T = 42.5 - (-18) = 60.5\,^\circ\text{C}\). A temperature difference has the same numerical value in kelvins and degrees Celsius. 4. The difference quotient is \(\frac{T(15) - T(5)}{15 - 5} = \frac{42.5 - 60.5}{10} = -1.8\,\frac{\text{K}}{\text{min}}\). 5. This quotient gives the average cooling rate over the full interval, or the slope of a secant line. The value \(T'(10)\) gives the instantaneous cooling rate at \(t = 10\), or the slope of the tangent line there. Without the temperature function, the instantaneous rate cannot be computed and may or may not equal the average rate.

Answer

a) \(60.5\,^\circ\text{C}\) b) \(\frac{T(15) - T(5)}{15 - 5} = -1.8\,\frac{\text{K}}{\text{min}}\). This is the secant slope over \([5, 15]\), while \(T'(10)\) is the tangent slope at \(t = 10\). The instantaneous rate cannot be determined without knowing \(T\).
52215712
Let \(f(x) = 2x^2 - x\). Find the average rate of change of \(f\) over \([2, 2 + h]\) in terms of \(h\), where \(h > 0\). Simplify your expression completely.

Hints

- Recall the difference-quotient formula. - Substitute both interval endpoints into the function. - Expand \((2 + h)^2\) carefully. - Factor the numerator so that you can simplify the quotient.

Solution

1. Evaluate the function at \(x = 2\): \(f(2) = 2 \cdot 2^2 - 2 = 6\). 2. Evaluate the function at \(x = 2 + h\): \(f(2 + h) = 2(2 + h)^2 - (2 + h) = 2(4 + 4h + h^2) - 2 - h = 2h^2 + 7h + 6\). 3. Form the difference quotient: \(\frac{f(2 + h) - f(2)}{(2 + h) - 2} = \frac{2h^2 + 7h}{h}\). 4. Since \(h > 0\), divide by \(h\): \(\frac{h(2h + 7)}{h} = 2h + 7\).

Answer

\(2h + 7\)
52215812
Let \(g(x) = \frac{3}{x}\), where \(x \ne 0\). Find the slope of the secant line through \(P(1, g(1))\) and \(Q(1 + a, g(1 + a))\), where \(a > 0\). Write your answer as a simplified expression in terms of \(a\).

Hints

- A secant slope is the average rate of change over the corresponding interval. - How do you combine the fractions in the numerator? - Can you factor the numerator so that a common factor cancels? - Be careful with signs when distributing.

Solution

1. Evaluate the function at the two inputs: \(g(1) = 3\) and \(g(1 + a) = \frac{3}{1 + a}\). 2. Form the secant slope: \(m_{\text{sec}} = \frac{g(1 + a) - g(1)}{(1 + a) - 1} = \frac{\frac{3}{1 + a} - 3}{a}\). 3. Combine the terms in the numerator: \(\frac{3}{1 + a} - 3 = \frac{3 - 3(1 + a)}{1 + a} = \frac{-3a}{1 + a}\). 4. Divide by \(a\): \(m_{\text{sec}} = \frac{-3a}{1 + a} \cdot \frac{1}{a} = -\frac{3}{1 + a}\).

Answer

\(-\frac{3}{1 + a}\)
52216012
The height of a ball thrown straight upward is modeled by \(h(t) = -5t^2 + 20t + 2\), where \(t\) is time in seconds and \(h(t)\) is height in meters. 1. Find the average rate of change of the height over \([0.5, 1.5]\). 2. Identify the physical quantity represented by this value and state its units. 3. Find a time \(b > 0\) such that the average rate of change of the height over \([0, b]\) is exactly \(10\,\frac{\text{m}}{\text{s}}\).

Hints

- Use the difference quotient \(\frac{h(t_2) - h(t_1)}{t_2 - t_1}\). - What quantity results when a change in height is divided by elapsed time? - For part 3, set the average-rate-of-change expression equal to \(10\). - Can you divide the numerator by \(b\) after simplifying?

Solution

1. Evaluate the endpoints: \(h(0.5) = -5 \cdot 0.5^2 + 20 \cdot 0.5 + 2 = 10.75\) and \(h(1.5) = -5 \cdot 1.5^2 + 20 \cdot 1.5 + 2 = 20.75\). Thus, \(\frac{h(1.5) - h(0.5)}{1.5 - 0.5} = \frac{20.75 - 10.75}{1} = 10\,\frac{\text{m}}{\text{s}}\). 2. This value is the ball’s average vertical velocity over the interval, measured in meters per second. 3. Set \(\frac{h(b) - h(0)}{b - 0} = 10\). Since \(h(0) = 2\), \(\frac{-5b^2 + 20b + 2 - 2}{b} = 10\). Because \(b > 0\), divide by \(b\): \(-5b + 20 = 10\). Solving gives \(b = 2\,\text{s}\).

Answer

1. \(10\,\frac{\text{m}}{\text{s}}\) 2. The ball’s average vertical velocity, in meters per second. 3. \(b = 2\,\text{s}\)
52217912
During its first 10 weeks of growth, the height of a wheat plant is modeled by \(h(t) = -0.1t^2 + 2t + 5\), where \(t\) is measured in weeks and \(h(t)\) in centimeters. 1. Find the plant’s average growth rate during the first 4 weeks and from week 4 to week 8. 2. Explain the geometric meaning of the average growth rate over \([0, 4]\) on the graph of \(h\). 3. Use the calculated rates to determine whether the plant’s growth is speeding up or slowing down in this model.

Hints

- What does a difference quotient represent in a real-world context? - What is the name of the line through two points on a function’s graph? - Compare the rates for the two time intervals.

Solution

1. Evaluate the needed values: \(h(0) = 5\), \(h(4) = -0.1 \cdot 4^2 + 2 \cdot 4 + 5 = 11.4\), and \(h(8) = -0.1 \cdot 8^2 + 2 \cdot 8 + 5 = 14.6\). Over \([0, 4]\), the average growth rate is \(\frac{11.4 - 5}{4} = 1.6\,\frac{\text{cm}}{\text{week}}\). Over \([4, 8]\), it is \(\frac{14.6 - 11.4}{4} = 0.8\,\frac{\text{cm}}{\text{week}}\). 2. The first average growth rate is the slope of the secant line through \((0, 5)\) and \((4, 11.4)\) on the graph. 3. The average growth rate decreases from \(1.6\) to \(0.8\) centimeters per week, so the plant’s growth slows over time in this model.

Answer

1. First 4 weeks: \(1.6\,\frac{\text{cm}}{\text{week}}\) Weeks 4 through 8: \(0.8\,\frac{\text{cm}}{\text{week}}\) 2. It is the slope of the secant line through the graph points at \(t = 0\) and \(t = 4\). 3. The growth is slowing because the average growth rate decreases.
52237512
A delivery van travels from a distribution center to a customer. The table shows the van’s distance from the distribution center over time. <table> <tr> <td>Time \(t\) (in \(\text{min}\))</td> <td>\(0\)</td> <td>\(10\)</td> <td>\(25\)</td> <td>\(30\)</td> <td>\(50\)</td> <td>\(65\)</td> <td>\(80\)</td> </tr> <tr> <td>Distance \(s\) (in \(\text{mi}\))</td> <td>\(0\)</td> <td>\(9\)</td> <td>\(9\)</td> <td>\(15\)</td> <td>\(33\)</td> <td>\(33\)</td> <td>\(48\)</td> </tr> </table> a) Find the van’s average speed for the entire trip in miles per minute. b) Find the average speed during the first \(30\) minutes and during the remaining time after minute \(30\). c) Compare the average speed during the first \(10\) minutes with the average speed during the final \(15\) minutes.

Hints

- What does distance traveled divided by elapsed time represent? - Which table values are the endpoints of each requested interval? - How is a secant slope calculated on a distance-time graph? - Identify the beginning and ending times carefully for each interval.

Solution

1. Over \([0, 80]\), the average speed is \(\frac{s(80) - s(0)}{80 - 0} = \frac{48 - 0}{80} = 0.6\,\frac{\text{mi}}{\text{min}}\). 2. Over \([0, 30]\), the average speed is \(\frac{15 - 0}{30} = 0.5\,\frac{\text{mi}}{\text{min}}\). 3. Over \([30, 80]\), the average speed is \(\frac{48 - 15}{50} = 0.66\,\frac{\text{mi}}{\text{min}}\). 4. Over \([0, 10]\), the average speed is \(\frac{9 - 0}{10} = 0.9\,\frac{\text{mi}}{\text{min}}\). Over \([65, 80]\), it is \(\frac{48 - 33}{15} = 1\,\frac{\text{mi}}{\text{min}}\). The average speed is greater during the final interval.

Answer

a) \(0.6\,\frac{\text{mi}}{\text{min}}\) b) First \(30\) minutes: \(0.5\,\frac{\text{mi}}{\text{min}}\) Remaining time: \(0.66\,\frac{\text{mi}}{\text{min}}\) c) First \(10\) minutes: \(0.9\,\frac{\text{mi}}{\text{min}}\) Final \(15\) minutes: \(1\,\frac{\text{mi}}{\text{min}}\). The final interval has the greater average speed.
52237612
During a \(20\)-second motor test, a test object moves in a fixed direction, and its velocity \(v\) is increased in stages. The table gives its velocity at selected times \(t\). <table> <tr> <td>Time \(t\) (in \(\text{s}\))</td> <td>\(0\)</td> <td>\(4\)</td> <td>\(10\)</td> <td>\(11\)</td> <td>\(15\)</td> <td>\(18\)</td> <td>\(20\)</td> </tr> <tr> <td>Velocity \(v\) (in \(\frac{\text{m}}{\text{s}}\))</td> <td>\(0\)</td> <td>\(12\)</td> <td>\(12\)</td> <td>\(18\)</td> <td>\(18\)</td> <td>\(25\)</td> <td>\(30\)</td> </tr> </table> a) Find the average acceleration over the entire test. b) Find the average acceleration during the first half, from \(0\) to \(10\) seconds, and during the second half, from \(10\) to \(20\) seconds. c) During which interval, \([0, 4]\) or \([18, 20]\), is the average acceleration greater? Support your answer with calculations.

Hints

- Average acceleration is the average rate of change of velocity. - Use \(\frac{\Delta v}{\Delta t}\). - Identify the correct endpoint times and speeds for each interval. - What average acceleration results when velocity does not change over an interval?

Solution

1. Over \([0, 20]\), the average acceleration is \(\frac{v(20) - v(0)}{20 - 0} = \frac{30 - 0}{20} = 1.5\,\frac{\text{m}}{\text{s}^2}\). 2. Over \([0, 10]\), it is \(\frac{12 - 0}{10} = 1.2\,\frac{\text{m}}{\text{s}^2}\). 3. Over \([10, 20]\), it is \(\frac{30 - 12}{10} = 1.8\,\frac{\text{m}}{\text{s}^2}\). 4. Over \([0, 4]\), it is \(\frac{12 - 0}{4} = 3\,\frac{\text{m}}{\text{s}^2}\). Over \([18, 20]\), it is \(\frac{30 - 25}{2} = 2.5\,\frac{\text{m}}{\text{s}^2}\). Therefore, the average acceleration is greater over \([0, 4]\).

Answer

a) \(1.5\,\frac{\text{m}}{\text{s}^2}\) b) First half: \(1.2\,\frac{\text{m}}{\text{s}^2}\) Second half: \(1.8\,\frac{\text{m}}{\text{s}^2}\) c) \([0, 4]\), because \(3\,\frac{\text{m}}{\text{s}^2} > 2.5\,\frac{\text{m}}{\text{s}^2}\).
52889112
Let \(f(x) = 0.5x^2 + 2\). The fixed point \(P(2, 4)\) lies on the graph of \(f\), and a second point \(Q(x, f(x))\) moves along the graph. a) Write the difference quotient for the slope of the secant line through \(P\) and \(Q\). b) Simplify the expression from part a as much as possible. c) Find the secant slope when \(x = 2.2\).

Hints

- Recall the slope formula for a line through two points. - Can you factor a common coefficient from the numerator? - After factoring, do you recognize a difference of squares? - What factor cancels from the numerator and denominator?

Solution

1. The secant slope is \(m_{\text{sec}} = \frac{f(x) - f(2)}{x - 2} = \frac{0.5x^2 + 2 - 4}{x - 2} = \frac{0.5x^2 - 2}{x - 2}\), where \(x \ne 2\). 2. Factor the numerator: \(\frac{0.5(x^2 - 4)}{x - 2} = \frac{0.5(x - 2)(x + 2)}{x - 2} = 0.5(x + 2) = 0.5x + 1\), where \(x \ne 2\). 3. For \(x = 2.2\), \(m_{\text{sec}} = 0.5(2.2 + 2) = 0.5 \cdot 4.2 = 2.1\).

Answer

a) \(m_{\text{sec}} = \frac{0.5x^2 - 2}{x - 2}\), where \(x \ne 2\) b) \(m_{\text{sec}} = 0.5x + 1\), where \(x \ne 2\) c) \(2.1\)
52889212
Let \(g(x) = x^2 - 5x\). a) Write the average rate of change of \(g\) over \([x_0, x_0 + h]\) in terms of \(x_0\) and \(h\), where \(h > 0\). b) Simplify the expression completely. c) Evaluate the average rate of change when \(x_0 = 3\) and \(h = 0.1\).

Hints

- Substitute \(x_0 + h\) and \(x_0\) into the function. - Be careful when subtracting the second function value. - Expand \((x_0 + h)^2\). - Factor \(h\) from the numerator before simplifying.

Solution

1. Form the difference quotient: \(\frac{g(x_0 + h) - g(x_0)}{h} = \frac{(x_0 + h)^2 - 5(x_0 + h) - (x_0^2 - 5x_0)}{h}\). 2. Expand and combine like terms: \(\frac{x_0^2 + 2x_0h + h^2 - 5x_0 - 5h - x_0^2 + 5x_0}{h} = \frac{2x_0h + h^2 - 5h}{h}\). 3. Factor and divide by \(h\): \(\frac{h(2x_0 + h - 5)}{h} = 2x_0 + h - 5\). 4. For \(x_0 = 3\) and \(h = 0.1\), the rate is \(2 \cdot 3 + 0.1 - 5 = 1.1\).

Answer

a) \(\frac{(x_0 + h)^2 - 5(x_0 + h) - (x_0^2 - 5x_0)}{h}\) b) \(2x_0 + h - 5\) c) \(1.1\)
52890512
Let \(f(x) = 2x^2 - 3\). The point \(P(-1, -1)\) lies on the graph of \(f\). Find and simplify the slope of the secant line through \(P\) and any other point \(Q(x, f(x))\) on the graph.

Hints

- Use the slope formula for a line through two points. - Substitute the expression for the point \(Q\) into the formula. - Be careful when subtracting a negative function value. - Factor the numerator to simplify the quotient.

Solution

1. Use the slope formula: \(m_{\text{sec}} = \frac{f(x) - f(-1)}{x - (-1)}\). 2. Substitute the function values: \(m_{\text{sec}} = \frac{(2x^2 - 3) - (-1)}{x + 1} = \frac{2x^2 - 2}{x + 1}\). 3. Factor the numerator: \(\frac{2(x^2 - 1)}{x + 1} = \frac{2(x - 1)(x + 1)}{x + 1}\). 4. Since \(x \ne -1\), simplify to \(m_{\text{sec}} = 2(x - 1) = 2x - 2\).

Answer

\(m_{\text{sec}} = 2x - 2\), where \(x \ne -1\)
52890612
Let \(g(x) = x^3 + 2\). Find a simplified expression for the slope of the secant line through the fixed point \(A(2, 10)\) and the variable point \(B(x, g(x))\) on the graph of \(g\).

Hints

- Use the difference quotient for the slope between two graph points. - Recall how to factor a difference of cubes such as \(x^3 - a^3\). - Polynomial division is another option when the denominator corresponds to a zero of the numerator.

Solution

1. Form the difference quotient: \(m_{\text{sec}} = \frac{g(x) - g(2)}{x - 2} = \frac{(x^3 + 2) - 10}{x - 2} = \frac{x^3 - 8}{x - 2}\). 2. Factor the difference of cubes: \(x^3 - 8 = (x - 2)(x^2 + 2x + 4)\). 3. Since \(x \ne 2\), cancel \(x - 2\) to obtain \(m_{\text{sec}} = x^2 + 2x + 4\).

Answer

\(m_{\text{sec}} = x^2 + 2x + 4\), where \(x \ne 2\)
52892512
A chemist records the temperature \(T\) of a hot liquid at several times \(t\). <table> <tr><td>Time \(t\) (in \(\text{min}\))</td><td>\(0\)</td><td>\(5\)</td><td>\(10\)</td><td>\(20\)</td><td>\(30\)</td><td>\(50\)</td></tr> <tr><td>Temperature \(T\) (in \(^\circ\text{C}\))</td><td>\(85.0\)</td><td>\(72.5\)</td><td>\(62.0\)</td><td>\(46.0\)</td><td>\(35.0\)</td><td>\(23.0\)</td></tr> </table> a) Find the average rate of change of the temperature during the first 10 minutes. b) Find the average rate of change from \(t = 20\) to \(t = 50\). c) During which interval, \([0, 5]\), \([5, 10]\), \([10, 20]\), \([20, 30]\), or \([30, 50]\), does the liquid cool fastest on average? Support your answer by calculating each rate.

Hints

- What does a secant slope represent in this context? - Track the units of each rate. - Divide the change in temperature by the change in time. - A negative rate means that the temperature is decreasing.

Solution

1. Over \([0, 10]\), \(\frac{T(10) - T(0)}{10 - 0} = \frac{62.0 - 85.0}{10} = -2.3\,\frac{^\circ\text{C}}{\text{min}}\). 2. Over \([20, 50]\), \(\frac{T(50) - T(20)}{50 - 20} = \frac{23.0 - 46.0}{30} = -\frac{23}{30} \approx -0.767\,\frac{^\circ\text{C}}{\text{min}}\). 3. The rates for the consecutive intervals are: \([0, 5]\): \(-2.5\,\frac{^\circ\text{C}}{\text{min}}\); \([5, 10]\): \(-2.1\,\frac{^\circ\text{C}}{\text{min}}\); \([10, 20]\): \(-1.6\,\frac{^\circ\text{C}}{\text{min}}\); \([20, 30]\): \(-1.1\,\frac{^\circ\text{C}}{\text{min}}\); \([30, 50]\): \(-0.6\,\frac{^\circ\text{C}}{\text{min}}\). The greatest cooling rate in magnitude occurs over \([0, 5]\).

Answer

a) \(-2.3\,\frac{^\circ\text{C}}{\text{min}}\) b) \(-\frac{23}{30}\,\frac{^\circ\text{C}}{\text{min}} \approx -0.767\,\frac{^\circ\text{C}}{\text{min}}\) c) \([0, 5]\), with an average rate of \(-2.5\,\frac{^\circ\text{C}}{\text{min}}\)
52892612
The table shows the size of a wildlife population in a protected area over several years. <table> <tr><td>Year</td><td>\(2015\)</td><td>\(2017\)</td><td>\(2018\)</td><td>\(2020\)</td><td>\(2023\)</td></tr> <tr><td>Number of animals</td><td>\(1200\)</td><td>\(1550\)</td><td>\(1820\)</td><td>\(1740\)</td><td>\(2100\)</td></tr> </table> a) Find the average annual rate of change of the population from 2015 to 2023. b) Find the average annual rates of change from 2017 to 2018 and from 2018 to 2020. c) Interpret the sign of the rate from 2018 to 2020 in context. d) During which interval between consecutive measurements was the average annual growth greatest?

Hints

- Divide the change in the population by the number of years in the interval. - What does a negative result mean for the population? - Compare the rates for all consecutive measurement intervals. - The time gaps between measurements are not all equal.

Solution

1. From 2015 to 2023, \(\frac{2100 - 1200}{2023 - 2015} = \frac{900}{8} = 112.5\,\frac{\text{animals}}{\text{year}}\). 2. From 2017 to 2018, \(\frac{1820 - 1550}{1} = 270\,\frac{\text{animals}}{\text{year}}\). From 2018 to 2020, \(\frac{1740 - 1820}{2} = -40\,\frac{\text{animals}}{\text{year}}\). 3. The negative rate means that the population decreased on average during 2018–2020. 4. The consecutive-interval rates are: 2015–2017, \(175\,\frac{\text{animals}}{\text{year}}\); 2017–2018, \(270\,\frac{\text{animals}}{\text{year}}\); 2018–2020, \(-40\,\frac{\text{animals}}{\text{year}}\); and 2020–2023, \(120\,\frac{\text{animals}}{\text{year}}\). The greatest average growth occurred from 2017 to 2018.

Answer

a) \(112.5\,\frac{\text{animals}}{\text{year}}\) b) 2017–2018: \(270\,\frac{\text{animals}}{\text{year}}\) 2018–2020: \(-40\,\frac{\text{animals}}{\text{year}}\) c) The population decreased during that interval. d) 2017–2018, with \(270\,\frac{\text{animals}}{\text{year}}\)
52892812
Find the slope of the tangent line to \(g(x) = |x|+2x\) at \(x = a\) in each case. a) \(a > 0\) b) \(a < 0\)

Hints

- Rewrite \(|x|\) separately for positive and negative values of \(x\). - Simplify the resulting linear expression in each case. - Read the slope from the coefficient of \(x\).

Solution

1. When \(x > 0\), \(|x| = x\). Therefore, \(g(x) = x+2x = 3x\), which has slope \(3\). 2. When \(x < 0\), \(|x| = -x\). Therefore, \(g(x) = -x+2x = x\), which has slope \(1\). 3. Thus, the tangent-line slope is \(3\) when \(a > 0\) and \(1\) when \(a < 0\).

Answer

a) \(3\) b) \(1\)
52893812
The total cost of removing pollutants at a wastewater treatment plant depends on the amount removed. The function \(C(x)\) gives the total cost in dollars of removing \(x\) kilograms of pollutants. Interpret each expression in context and give its units. a) \(C(x)-C(x_0)\) b) \(\frac{C(x)-C(x_0)}{x-x_0}\) c) \(C'(x_0)\)

Hints

- A difference of cost values represents a change in total cost. - Dividing a cost change by an amount change gives cost per unit of amount. - In economics, the derivative of a cost function is called marginal cost.

Solution

1. \(C(x)-C(x_0)\) is the change in total cost when the amount of pollutants removed changes from \(x_0\) kilograms to \(x\) kilograms. Its units are dollars. 2. \(\frac{C(x)-C(x_0)}{x-x_0}\) is the average change in cost per kilogram between \(x_0\) and \(x\). Its units are dollars per kilogram. 3. \(C'(x_0)\) is the marginal cost at \(x_0\). It approximates the additional cost of removing one more kilogram when \(x_0\) kilograms have already been removed. Its units are dollars per kilogram.

Answer

a) The change in total cost, measured in dollars b) The average change in cost per kilogram from \(x_0\) to \(x\), measured in dollars per kilogram c) The marginal cost at \(x_0\), measured in dollars per kilogram
52895012
Suppose \(h'(x)=-0.5\) for every real number \(x\). 1. What type of function is \(h\)? Describe the graph of \(h\). 2. Find an equation for \(h\) if \(h(4)=2\). 3. Another function is defined by \(g(x)=h(x)+10\). Compare \(g'\) and \(h'\), and explain the result geometrically.

Hints

- What shape has a graph whose rate of change is constant? - How are the slope of a line and its derivative related? - What happens to slopes when a graph is translated only upward or downward? - Recall the derivative rule for adding a constant.

Solution

1. Since the derivative is constant, \(h\) is linear. Because the derivative is negative, its graph is a decreasing line. 2. Write \(h(x)=-0.5x+b\). Using \(h(4)=2\), \(2=-0.5\cdot 4+b=-2+b\), so \(b=4\). Therefore, \(h(x)=-0.5x+4\). 3. The derivatives are identical: \(g'(x)=h'(x)=-0.5\). Adding \(10\) translates the graph vertically upward by \(10\) units, which does not change any slope.

Answer

1. \(h\) is linear, and its graph is a decreasing line. 2. \(h(x)=-0.5x+4\) 3. \(g'(x)=h'(x)=-0.5\). A vertical translation does not change the slope.
52895512
A sled moves down a snowy hill. Its distance traveled, in meters, is modeled by \(s(t) = \frac{1}{2}at^2\), where \(t\) is time in seconds and \(a\) is the constant acceleration down the hill. a) Derive a simplified expression for the average velocity \(v_{\text{avg}}\) over \([t_1, t_2]\), where \(t_1 < t_2\). b) Find the average velocity when \(a = 2.4\,\frac{\text{m}}{\text{s}^2}\), \(t_1 = 5\,\text{s}\), and \(t_2 = 15\,\text{s}\).

Hints

- How is average velocity defined using distance traveled and elapsed time? - Write the difference quotient for \(s(t)\). - Use the difference-of-squares factorization to simplify. - Substitute the values only after simplifying the general expression.

Solution

1. Form the difference quotient: \(\frac{s(t_2) - s(t_1)}{t_2 - t_1} = \frac{\frac{1}{2}at_2^2 - \frac{1}{2}at_1^2}{t_2 - t_1}\). 2. Factor the numerator: \(\frac{\frac{1}{2}a(t_2^2 - t_1^2)}{t_2 - t_1} = \frac{\frac{1}{2}a(t_2 - t_1)(t_2 + t_1)}{t_2 - t_1}\). 3. Since \(t_1 < t_2\), cancel \(t_2 - t_1\): \(v_{\text{avg}} = \frac{1}{2}a(t_1 + t_2)\). 4. Substitute the given values: \(v_{\text{avg}} = \frac{1}{2} \cdot 2.4 \cdot (5 + 15) = 24\,\frac{\text{m}}{\text{s}}\).

Answer

a) \(v_{\text{avg}} = \frac{1}{2}a(t_1 + t_2)\) b) \(24\,\frac{\text{m}}{\text{s}}\)
52895612
Let \(f(x) = 0.2x^2 + 3\). a) Find the slope of the secant line through \(P(2, f(2))\) and \(Q(7, f(7))\). b) Find \(x_2 > 0\) such that the average rate of change of \(f\) over \([0, x_2]\) is exactly \(1.6\).

Hints

- How are secant slope and average rate of change related? - Use the slope formula with the two given graph points. - For part b, write an equation with \(x_2\) as the unknown. - Simplify the quotient before solving the equation.

Solution

1. Evaluate the function values: \(f(2) = 0.2 \cdot 2^2 + 3 = 3.8\) and \(f(7) = 0.2 \cdot 7^2 + 3 = 12.8\). 2. The secant slope is \(\frac{f(7) - f(2)}{7 - 2} = \frac{12.8 - 3.8}{5} = 1.8\). 3. For part b, set \(\frac{f(x_2) - f(0)}{x_2 - 0} = 1.6\). Since \(f(0) = 3\), \(\frac{0.2x_2^2}{x_2} = 1.6\). 4. Because \(x_2 > 0\), divide by \(x_2\): \(0.2x_2 = 1.6\), so \(x_2 = 8\).

Answer

a) \(1.8\) b) \(x_2 = 8\)
52901712
Under favorable conditions, an algae patch on a lake grows exponentially. At the beginning of the observation, it covers \(2.0\,\text{m}^2\). The covered area increases by \(25\%\) each week. a) Write a function in the form \(A(t) = ab^t\) that gives the area \(A\), in square meters, after \(t\) weeks. b) Find the area after \(4\) weeks and after \(8\) weeks. c) Find the average rate of change of the area during the first \(4\) weeks and from week \(4\) to week \(8\).

Hints

- How is a percent increase converted to a growth factor? - What does \(a\) represent in an exponential model? - Use the secant-slope formula between the endpoint values. - What units should an area growth rate have?

Solution

1. The initial value is \(a = 2\), and the weekly growth factor is \(b = 1 + 0.25 = 1.25\). Therefore, \(A(t) = 2 \cdot 1.25^t\). 2. \(A(4) = 2 \cdot 1.25^4 \approx 4.8828\,\text{m}^2\), and \(A(8) = 2 \cdot 1.25^8 \approx 11.9209\,\text{m}^2\). 3. Over \([0, 4]\), the average rate is \(\frac{A(4) - A(0)}{4} \approx \frac{4.8828 - 2}{4} \approx 0.7207\,\frac{\text{m}^2}{\text{week}}\). 4. Over \([4, 8]\), the average rate is \(\frac{A(8) - A(4)}{4} \approx \frac{11.9209 - 4.8828}{4} \approx 1.7595\,\frac{\text{m}^2}{\text{week}}\).

Answer

a) \(A(t) = 2 \cdot 1.25^t\) b) After \(4\) weeks: approximately \(4.88\,\text{m}^2\) After \(8\) weeks: approximately \(11.92\,\text{m}^2\) c) First \(4\) weeks: approximately \(0.72\,\frac{\text{m}^2}{\text{week}}\) Weeks \(4\) through \(8\): approximately \(1.76\,\frac{\text{m}^2}{\text{week}}\)
52901812
A new electric bicycle costs \(\$5000\). Because of age and use, its market value decreases by \(15\%\) each year. The value is modeled by an exponential function \(V(t) = ab^t\), where \(t\) is the number of years since purchase and \(V\) is measured in dollars. a) Write the function \(V(t)\). b) Find the average rate of change of the value during the first two years. c) Find the average rate of change from year \(5\) to year \(7\). Compare it with the result from part b and explain the difference.

Hints

- What factor represents a decrease by a fixed percent? - What does a negative rate of change mean in this context? - Use the average-rate-of-change formula over each time interval. - Why does the same percent loss produce a smaller dollar loss later?

Solution

1. The initial value is \(a = 5000\), and the annual decay factor is \(b = 1 - 0.15 = 0.85\). Thus, \(V(t) = 5000 \cdot 0.85^t\). 2. \(V(0) = 5000\) and \(V(2) = 5000 \cdot 0.85^2 = 3612.50\). Over \([0, 2]\), the average rate of change is \(\frac{3612.50 - 5000}{2} = -693.75\,\frac{\text{dollars}}{\text{year}}\). 3. \(V(5) = 5000 \cdot 0.85^5 \approx 2218.53\) and \(V(7) = 5000 \cdot 0.85^7 \approx 1602.89\). Over \([5, 7]\), the average rate of change is \(\frac{1602.89 - 2218.53}{2} \approx -307.82\,\frac{\text{dollars}}{\text{year}}\). 4. The later rate has smaller magnitude because the same \(15\%\) loss is applied to a lower market value.

Answer

a) \(V(t) = 5000 \cdot 0.85^t\) b) \(-\$693.75\) per year c) Approximately \(-\$307.82\) per year. The later annual dollar loss is smaller because the bicycle has a lower value by years \(5\) through \(7\).
52904812
A newly installed solar energy system has a value of \(\$15{,}000\). Because of aging and technological advances, its value decreases by \(4\%\) each year. a) Write a function \(W(t) = W_0 \cdot a^t\) that gives the value \(W\), in dollars, after \(t\) years. b) Find the average annual rate of change of the value during the first five years and from year \(10\) to year \(15\). c) Compare the two results and explain why they differ even though the annual percent loss is constant.

Hints

- What factor represents an annual decrease of \(4\%\)? - Use the difference quotient over each requested interval. - How does the base amount to which the \(4\%\) applies change over time?

Solution

1. The initial value is \(W_0 = 15{,}000\), and the annual decay factor is \(a = 1 - 0.04 = 0.96\). Thus, \(W(t) = 15{,}000 \cdot 0.96^t\). 2. For \([0, 5]\), \(W(0) = 15{,}000\) and \(W(5) = 15{,}000 \cdot 0.96^5 \approx 12{,}230.59\). The average rate is \(\frac{12{,}230.59 - 15{,}000}{5} \approx -553.88\,\frac{\text{dollars}}{\text{year}}\). 3. For \([10, 15]\), \(W(10) = 15{,}000 \cdot 0.96^{10} \approx 9972.49\) and \(W(15) = 15{,}000 \cdot 0.96^{15} \approx 8131.30\). The average rate is \(\frac{8131.30 - 9972.49}{5} \approx -368.24\,\frac{\text{dollars}}{\text{year}}\). 4. The later rate has smaller magnitude because the constant \(4\%\) loss is applied to a smaller remaining value.

Answer

a) \(W(t) = 15{,}000 \cdot 0.96^t\) b) \([0, 5]\): approximately \(-\$553.88\) per year \([10, 15]\): approximately \(-\$368.24\) per year c) The absolute loss becomes smaller because the same \(4\%\) is applied to a decreasing value.
53234312
The two panels show the graphs of \(f\) and \(g\). Difference quotient I: \(\frac{2.5 - (-1.5)}{3 - 1}\) Difference quotient II: \(\frac{0 - 1}{2 - 0}\) 1. Match each difference quotient to the appropriate graph. Justify each match by identifying the corresponding points on the graph. 2. Calculate the average rate of change for each function over its corresponding interval.
Figure for problem 532343

Hints

- In a difference quotient, what do the denominator values tell you about the interval? - Read the corresponding function values from each graph. - Check which graph contains the two points represented by each quotient. - After matching, simplify each quotient.

Solution

1. Difference quotient I uses the points \((1, -1.5)\) and \((3, 2.5)\), which lie on the graph of \(f\). It represents the average rate of change of \(f\) over \([1, 3]\). 2. Difference quotient II uses the points \((0, 1)\) and \((2, 0)\), which lie on the graph of \(g\). It represents the average rate of change of \(g\) over \([0, 2]\). 3. For \(f\), \(\frac{2.5 - (-1.5)}{3 - 1} = \frac{4}{2} = 2\). 4. For \(g\), \(\frac{0 - 1}{2 - 0} = -\frac{1}{2} = -0.5\).

Answer

1. Quotient I matches \(f\) over \([1, 3]\), using \((1, -1.5)\) and \((3, 2.5)\). Quotient II matches \(g\) over \([0, 2]\), using \((0, 1)\) and \((2, 0)\). 2. \(f\): \(2\) \(g\): \(-0.5\)
53235012
The graph of \(f\) includes tangent line \(t_1\) at \(x = -2\) and tangent line \(t_2\) at \(x = 0\). a) Use the tangent lines to find \(f'(-2)\) and \(f'(0)\). b) Estimate \(f'(2)\) and \(f'(1)\) from the shape of the graph.
Figure for problem 532350

Hints

- A derivative value is the slope of the tangent line. - Use two grid points on each drawn tangent line. - For an undrawn tangent, estimate the direction and steepness of the curve nearby. - Use the graph's symmetry to compare slopes at \(x = -2\) and \(x = 2\).

Solution

1. Tangent line \(t_1\) passes through \((-4, 0)\) and \((-2, -2)\). Its slope is \(\frac{-2-0}{-2-(-4)} = -1\), so \(f'(-2) = -1\). 2. Tangent line \(t_2\) passes through \((0, 0)\) and \((1, 2)\). Its slope is \(\frac{2-0}{1-0} = 2\), so \(f'(0) = 2\). 3. The graph is symmetric about the origin, and the tangent slope at \(x = 2\) matches the slope at \(x = -2\). Thus, \(f'(2)\approx -1\). 4. Near \(x = 1\), a tangent line would rise about \(1.25\) units for each unit of run, so \(f'(1)\approx 1.25\).

Answer

a) \(f'(-2) = -1\) and \(f'(0) = 2\) b) \(f'(2)\approx -1\) and \(f'(1)\approx 1.25\)
53235812
Use the graph of \(f\) to complete both parts. **Part 1: Average rate of change** Find the average rate of change of \(f\) over each interval: a) \([-1, 3]\) b) \([0, 4]\) c) \([3, 5]\) **Part 2: Statements about the derivative** Determine whether each statement about \(f'\) is true or false. Briefly justify your answer. (1) \(f'(2) < 0\) (2) \(f'(1) = 0\) (3) On \([1, 3]\), the graph of \(f'\) lies above the x-axis.
Figure for problem 532358

Hints

- Average rate of change is the slope of the secant line through the endpoint points. - Use the marked points to read the function values accurately. - The value \(f'(x)\) is the tangent slope of the graph at \(x\). - Connect increasing, decreasing, and horizontal behavior to the sign of the derivative.

Solution

1. Read the graph values: \(f(-1) = -3\), \(f(0) = 1\), \(f(1) = 2\), \(f(3) = 1\), \(f(4) = 2\), and \(f(5) = 6\). 2. For Part 1: a) \(\frac{f(3) - f(-1)}{3 - (-1)} = \frac{1 - (-3)}{4} = 1\). b) \(\frac{f(4) - f(0)}{4 - 0} = \frac{2 - 1}{4} = 0.25\). c) \(\frac{f(5) - f(3)}{5 - 3} = \frac{6 - 1}{2} = 2.5\). 3. For Part 2: (1) True. The graph of \(f\) is decreasing at \(x = 2\), so the tangent slope is negative and \(f'(2) < 0\). (2) True. The graph has a local maximum at \(x = 1\), so the tangent is horizontal and \(f'(1) = 0\). (3) False. The graph decreases for \(1 < x < 3\), so \(f'(x) < 0\) there; at \(x = 1\) and \(x = 3\), \(f'(x) = 0\).

Answer

**Part 1:** a) \(1\) b) \(0.25\) c) \(2.5\) **Part 2:** (1) True (2) True (3) False
53249712
Panels 1, 2, and 3 show the graphs of three functions \(f\), \(g\), and \(h\). Each graph matches exactly one difference-quotient card: * **Card A:** \(\frac{1 - 1}{4 - 0} = 0\) * **Card B:** \(\frac{1 - (-1)}{3 - (-1)} = 0.5\) * **Card C:** \(\frac{-1 - 0}{2 - 0} = -0.5\) Match each graph to its card. Justify each match by stating the two graph points used in the difference quotient.
Figure for problem 532497

Hints

- Read each quotient as \(\frac{y_2 - y_1}{x_2 - x_1}\). - Identify the two points represented by each card. - Find the graph that contains both points. - Pay close attention to negative coordinates.

Solution

1. Card A represents the points \((0, 1)\) and \((4, 1)\). Only graph 1, the graph of \(f\), contains both points. Therefore, graph 1 matches Card A. 2. Card B represents the points \((-1, -1)\) and \((3, 1)\). Only graph 2, the graph of \(g\), contains both points. Therefore, graph 2 matches Card B. 3. Card C represents the points \((0, 0)\) and \((2, -1)\). Only graph 3, the graph of \(h\), contains both points. Therefore, graph 3 matches Card C.

Answer

Graph 1: Card A, using \((0, 1)\) and \((4, 1)\) Graph 2: Card B, using \((-1, -1)\) and \((3, 1)\) Graph 3: Card C, using \((0, 0)\) and \((2, -1)\)
53250012
The graph shows the elevation profile of a mountain-bike trail. Horizontal distance from the trailhead is shown on the x-axis, and elevation above sea level is shown on the y-axis. The trail starts at \(1300\,\text{m}\) and ends at \(820\,\text{m}\). a) Find the average grade, as a percent, over the entire trail. b) Find the average grade over the first half of the horizontal distance, from \(0\) to \(800\) meters, and over the second half, from \(800\) to \(1600\) meters. Compare the results. c) A rider claims, “Because the average grade over the first half is \(-45\%\), no part of that section can be steeper than \(-50\%\).” Explain why this claim is not generally valid.
Figure for problem 532500

Hints

- Use change in elevation divided by change in horizontal distance. - Express the resulting decimal as a percent. - A negative grade represents a descent. - Does an average place a maximum on every local value?

Solution

1. Average grade is \(\frac{\text{change in elevation}}{\text{change in horizontal distance}}\), expressed as a percent. 2. Over the entire trail, \(\frac{820 - 1300}{1600 - 0} = \frac{-480}{1600} = -0.30 = -30\%\). 3. Over the first half, \(\frac{940 - 1300}{800 - 0} = \frac{-360}{800} = -0.45 = -45\%\). 4. Over the second half, \(\frac{820 - 940}{1600 - 800} = \frac{-120}{800} = -0.15 = -15\%\). The first half has three times the average downhill grade in magnitude. 5. An average grade describes only the net elevation change over the whole interval. Shorter portions may be steeper than \(-50\%\) if flatter portions offset them.

Answer

a) \(-30\%\) b) First half: \(-45\%\) Second half: \(-15\%\). The first half is three times as steep on average in magnitude. c) An average does not determine the steepest local grade, so some shorter sections could be steeper than \(-50\%\).
53250212
For the first \(10\) days after sprouting, a seedling's height is modeled by \(H(t) = -0.015625t^2+0.375t+0.5\), where \(t\) is measured in days and \(H(t)\) is measured in inches. a) Use the tangent line shown at day \(4\) to estimate the instantaneous growth rate. Explain how you found the estimate. b) Find the average growth rate during the first \(4\) days, and compare it with the instantaneous growth rate on day \(4\). c) Explain how the graph shows that the growth rate decreases throughout the \(10\)-day period.
Figure for problem 532502

Hints

- Instantaneous growth rate is represented by a tangent-line slope. - Use two readable grid points on the shown tangent line to estimate its slope. - Average growth rate is change in height divided by change in time. - Observe how the steepness of the curve changes from left to right.

Solution

1. The shown tangent line at day \(4\) passes through the grid points \((1, 1)\) and \((5, 2)\). 2. Its slope is \(\frac{2-1}{5-1} = \frac{1}{4} = 0.25\). The instantaneous growth rate on day \(4\) is \(0.25\,\frac{\text{in.}}{\text{day}}\). 3. Evaluate the endpoint heights: \(H(0) = 0.5\) and \(H(4) = 1.75\). 4. The average growth rate is \(\frac{H(4)-H(0)}{4-0} = \frac{1.75-0.5}{4} = 0.3125\,\frac{\text{in.}}{\text{day}}\). 5. The average rate over the first four days is greater than the instantaneous rate on day \(4\). 6. The graph becomes less steep from left to right, so the slopes of its tangent lines decrease as time increases.

Answer

a) \(0.25\,\frac{\text{in.}}{\text{day}}\) b) \(0.3125\,\frac{\text{in.}}{\text{day}}\); the average rate is greater than the instantaneous rate on day \(4\). c) The curve becomes progressively flatter, so its tangent slopes decrease over time.
53250412
The time-height graph shows a 60-minute hot-air-balloon flight. a) Describe the flight during \([0, 20]\), \([20, 40]\), and \([40, 60]\), with time measured in minutes. b) Find and interpret the average rate of change of the height, in meters per minute, over each interval. c) An observer claims, “Because the average upward velocity over \([0, 20]\) is \(15\,\frac{\text{m}}{\text{min}}\), the balloon must have been at \(250\,\text{m}\) after exactly \(10\) minutes.” Evaluate both the numerical conclusion and the reasoning.
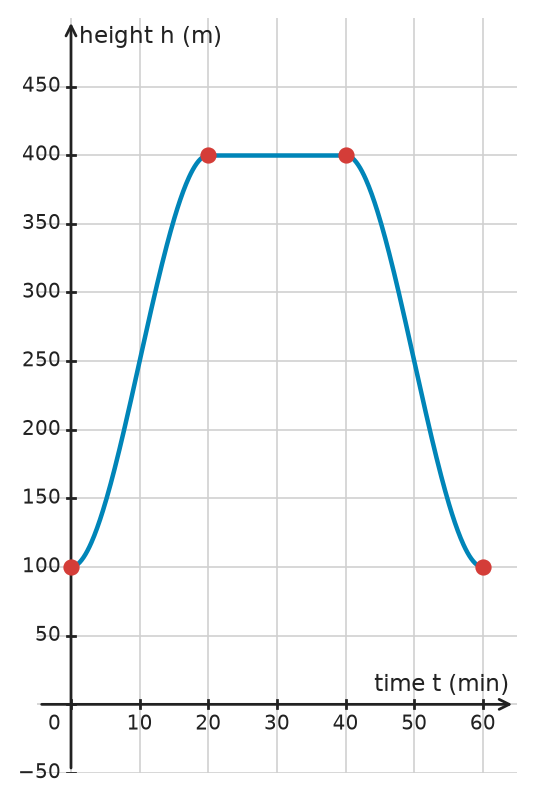
Figure for problem 532504

Hints

- Identify what each axis and unit represent. - Use the slope between the endpoint points of each interval. - What does a negative vertical rate mean? - Does an average velocity have to equal the velocity at every moment? - Can you assume a curved graph is linear between its endpoints?

Solution

1. From \(0\) to \(20\) minutes, the balloon rises from \(100\,\text{m}\) to \(400\,\text{m}\), first slowly, then more quickly, and then more slowly. From \(20\) to \(40\) minutes, it remains at \(400\,\text{m}\). From \(40\) to \(60\) minutes, it descends to \(100\,\text{m}\), with a changing descent rate. 2. Over \([0, 20]\), the average rate is \(\frac{400 - 100}{20} = 15\,\frac{\text{m}}{\text{min}}\). Over \([20, 40]\), it is \(\frac{400 - 400}{20} = 0\,\frac{\text{m}}{\text{min}}\). Over \([40, 60]\), it is \(\frac{100 - 400}{20} = -15\,\frac{\text{m}}{\text{min}}\). 3. The graph does show \(h(10) = 250\,\text{m}\), so the numerical conclusion happens to be correct. However, using the average rate to assume constant linear motion is invalid because the graph is curved. The agreement occurs because of the shape and symmetry of this particular graph.

Answer

a) \([0, 20]\): the balloon rises from \(100\,\text{m}\) to \(400\,\text{m}\) at a changing rate. \([20, 40]\): it stays at \(400\,\text{m}\). \([40, 60]\): it descends from \(400\,\text{m}\) to \(100\,\text{m}\) at a changing rate. b) \([0, 20]\): \(15\,\frac{\text{m}}{\text{min}}\) \([20, 40]\): \(0\,\frac{\text{m}}{\text{min}}\) \([40, 60]\): \(-15\,\frac{\text{m}}{\text{min}}\) c) The graph gives \(h(10) = 250\,\text{m}\), but the observer’s reasoning is invalid because an average velocity does not imply constant velocity.

53250512
The graph shows a function \(f\) and its tangent line \(t\) at \(x = 2\). a) Use the graph to find \(f(0)\) and \(f(6)\). b) Find the average rate of change of \(f\) over \([0, 6]\). Explain its geometric meaning. c) Find the instantaneous rate of change \(f'(2)\). Explain its geometric meaning.
Figure for problem 532505

Hints

- Read a function value by matching an x-coordinate to its y-coordinate on the graph. - Average rate of change is the slope of the secant line through the endpoint points. - Instantaneous rate of change is the slope of the tangent line. - Use two visible points on the tangent line to calculate its slope.

Solution

1. From the graph, \(f(0) = 1\) and \(f(6) = 4\). 2. Over \([0, 6]\), the average rate is \(\frac{f(6) - f(0)}{6 - 0} = \frac{4 - 1}{6} = 0.5\). Geometrically, this is the slope of the secant line through \((0, 1)\) and \((6, 4)\). 3. The tangent line at \(x = 2\) passes through \((0, 2)\) and \((2, 4)\), so \(f'(2) = \frac{4 - 2}{2 - 0} = 1\). Geometrically, this is the slope of the tangent line to the graph at \((2, 4)\).

Answer

a) \(f(0) = 1\) and \(f(6) = 4\) b) \(0.5\), the slope of the secant line through \((0, 1)\) and \((6, 4)\) c) \(f'(2) = 1\), the slope of the tangent line at \((2, 4)\)
53251112
The graph shows the water level \(h\), in feet, in a harbor during a \(12\)-hour tide cycle. Time \(t\) is measured in hours after midnight, and points \(A\), \(B\), \(C\), and \(D\) mark selected times. a) Interpret the instantaneous rate of change of the water level and give its units. b) Estimate the instantaneous rates of change at \(A(3, 10)\) and \(B(6, 16)\). Tangent lines are drawn at \(A\) and \(D\). c) A student claims, “At \(t = 10\), point \(D\), the water level is falling especially fast at about \(4\) feet per hour.” Evaluate the claim by estimating the instantaneous rate at \(D(10, 7)\) from the tangent line.
Figure for problem 532511

Hints

- Interpret slope as change in water level divided by change in time. - Use the drawn tangent line at \(A\) to estimate rise over run. - A local maximum has a horizontal tangent. - Use the drawn tangent at \(D\), and pay attention to both the sign and magnitude of its slope.

Solution

1. The instantaneous rate of change describes how quickly the water level is rising or falling at a specific time. Its units are feet per hour. 2. At \(A\), the tangent line rises about \(12.566\) feet over \(4\) hours, so its slope is \(\approx 3.14\,\frac{\text{ft}}{\text{h}}\). 3. Point \(B\) is a maximum, so its tangent is horizontal and the instantaneous rate is \(0\,\frac{\text{ft}}{\text{h}}\). 4. At \(D\), the drawn tangent line passes approximately through \((9, 9.721)\) and \((11, 4.279)\). Its slope is \(\frac{4.279-9.721}{11-9} \approx -2.72\,\frac{\text{ft}}{\text{h}}\). 5. The negative sign means the level is falling, but its magnitude is about \(2.72\), not \(4\). The student's estimate is too high.

Answer

a) The rate tells how quickly the water level is rising or falling at one time, measured in feet per hour. b) At \(A\): \(\approx 3.14\,\frac{\text{ft}}{\text{h}}\); at \(B\): \(0\,\frac{\text{ft}}{\text{h}}\) c) The claim is incorrect. At \(D\), the tangent-line estimate is \(\approx -2.72\,\frac{\text{ft}}{\text{h}}\), so the water level is falling at about \(2.72\) feet per hour.
53251312
The graph shows the water level \(h(t)\), in meters, in a large tank over time \(t\), in hours. The dashed line is tangent to the graph at the inflection point \(W(2, 6)\). a) Find the average rate of change of the water level on \([0, 4]\) and on \([4, 6]\). b) Find the instantaneous rate of change at \(t = 4\) from the graph, and interpret it in context. c) Use the drawn tangent line to find the maximum instantaneous rate of change during the process. When does it occur?
Figure for problem 532513

Hints

- Average rate of change is a secant-line slope. - At a maximum, the tangent line is horizontal. - Use two clear points on the dashed tangent line to calculate its slope. - The steepest upward part of the graph has the greatest positive instantaneous rate.

Solution

1. From the graph, \(h(0) = 2\) and \(h(4) = 10\). The average rate on \([0, 4]\) is \(\frac{10-2}{4-0} = 2\,\frac{\text{m}}{\text{h}}\). 2. Also, \(h(6) = 2\). The average rate on \([4, 6]\) is \(\frac{2-10}{6-4} = -4\,\frac{\text{m}}{\text{h}}\). 3. At \(t = 4\), the graph has a maximum and a horizontal tangent, so the instantaneous rate is \(0\,\frac{\text{m}}{\text{h}}\). The water level is momentarily neither rising nor falling. 4. At \(W(2, 6)\), the graph is rising most steeply. The tangent line passes through \((0, 0)\) and \((2, 6)\), so its slope is \(\frac{6-0}{2-0} = 3\,\frac{\text{m}}{\text{h}}\). 5. The maximum instantaneous rate is \(3\,\frac{\text{m}}{\text{h}}\), reached at \(t = 2\) hours.

Answer

a) On \([0, 4]\): \(2\,\frac{\text{m}}{\text{h}}\); on \([4, 6]\): \(-4\,\frac{\text{m}}{\text{h}}\) b) \(0\,\frac{\text{m}}{\text{h}}\); the water level is momentarily constant at its maximum. c) \(3\,\frac{\text{m}}{\text{h}}\) at \(t = 2\) hours
53252512
The graph of \(f\) has marked points \(P_1\), \(P_2\), and \(P_3\) at \(x_1 = -1\), \(x_2 = 0\), and \(x_3 = 2\). Match each x-value with its instantaneous rate of change. Value A: \(-1\) Value B: \(0.5\) Value C: \(3\) Give your answer in the form “\(x_1\): Value ..., \(x_2\): Value ..., \(x_3\): Value ...”.
Figure for problem 532525

Hints

- Instantaneous rate of change is the slope of a tangent line. - Imagine a tangent line at each marked point. - Compare how steeply the graph rises or falls. - Use the sign of each listed value to eliminate mismatches.

Solution

1. At \(x_1 = -1\), the graph rises gently. The tangent slope is \(0.5\), which is Value B. 2. At \(x_2 = 0\), the graph rises steeply. The tangent slope is \(3\), which is Value C. 3. At \(x_3 = 2\), the graph falls. The tangent slope is \(-1\), which is Value A.

Answer

\(x_1\): Value B, \(x_2\): Value C, \(x_3\): Value A
53253512
The graph shows the elevation profile of a 12K trail run. Horizontal distance is measured in kilometers, and elevation is measured in meters. a) Find the average grade, as a percent, for each section: 1. From the start to point \(B\) at kilometer \(4\) 2. From point \(B\) to point \(C\) at kilometer \(8\) 3. From point \(C\) to the finish at kilometer \(12\) b) Find the average grade over the entire course. Briefly assess whether this value accurately represents the effort required by the run.
Figure for problem 532535

Hints

- Convert kilometers to meters before calculating a percent grade. - Grade is change in elevation divided by horizontal distance. - What does a negative grade mean? - Can uphill and downhill changes cancel in a net average?

Solution

1. Convert each \(4\)-kilometer horizontal interval to \(4000\,\text{m}\), and convert the full \(12\)-kilometer course to \(12{,}000\,\text{m}\). 2. From the start to \(B\), the elevation change is \(260 - 100 = 160\,\text{m}\). The average grade is \(\frac{160}{4000} = 0.04 = 4\%\). 3. From \(B\) to \(C\), the elevation change is \(180 - 260 = -80\,\text{m}\). The average grade is \(\frac{-80}{4000} = -0.02 = -2\%\). 4. From \(C\) to the finish, the elevation change is \(420 - 180 = 240\,\text{m}\). The average grade is \(\frac{240}{4000} = 0.06 = 6\%\). 5. Over the full course, the elevation change is \(420 - 100 = 320\,\text{m}\). The average grade is \(\frac{320}{12{,}000} = \frac{2}{75} \approx 0.0267 \approx 2.67\%\). 6. The overall average can understate the effort because uphill and downhill sections offset each other, while the runner still experiences the separate climbs and descents.

Answer

a) 1. \(4\%\) 2. \(-2\%\) 3. \(6\%\) b) Approximately \(2.67\%\). This single average does not represent the effort well because the climbs and descents partly cancel.
53253812
The water level in a small mountain reservoir is modeled by \(h(t) = -0.1t^3 + 0.9t^2 - 1.8t + 3\) for \(0 \le t \le 8\), where \(t\) is measured in hours and \(h(t)\) in meters. The graph of \(h\) is shown. a) Find the average rate of change of the water level over each interval: (1) \([1, 5]\) (2) \([0, 6]\) (3) \([5, 8]\) b) Use the graph to decide whether each statement about the instantaneous rate of change is true or false. Briefly justify each answer. (1) At \(t = 3\), the water level is rising. (2) The water level is falling throughout \([0, 3]\). (3) The instantaneous rate of change is positive throughout \([2, 4]\).
Figure for problem 532538

Hints

- Average rate of change uses the endpoint function values. - A secant slope represents average change over an interval. - A positive tangent slope means the graph is rising; a negative tangent slope means it is falling. - Check whether the graph changes direction within each interval.

Solution

1. Evaluate the needed values: \(h(0) = 3\), \(h(1) = 2\), \(h(5) = 4\), \(h(6) = 3\), and \(h(8) = -5\). 2. The average rates are: over \([1, 5]\), \(\frac{4 - 2}{4} = 0.5\,\frac{\text{m}}{\text{h}}\); over \([0, 6]\), \(\frac{3 - 3}{6} = 0\,\frac{\text{m}}{\text{h}}\); and over \([5, 8]\), \(\frac{-5 - 4}{3} = -3\,\frac{\text{m}}{\text{h}}\). 3. Statement (1) is true. The graph has positive slope at \(t = 3\); algebraically, \(h'(3) = 0.9 > 0\). 4. Statement (2) is false. The graph reaches a local minimum at about \(t \approx 1.27\) and then rises before \(t = 3\). 5. Statement (3) is true. The graph is increasing throughout \([2, 4]\); its critical points occur at approximately \(t \approx 1.27\) and \(t \approx 4.73\).

Answer

a) (1) \(0.5\,\frac{\text{m}}{\text{h}}\) (2) \(0\,\frac{\text{m}}{\text{h}}\) (3) \(-3\,\frac{\text{m}}{\text{h}}\) b) (1) True (2) False (3) True
53253912
The distance-time graph shows a cyclist’s first \(10\) minutes of a training ride. Time \(t\) is measured in minutes, and distance \(s\) is measured in miles. a) Find the cyclist’s average speed for the entire ride, from \(t = 0\) to \(t = 10\), in miles per hour. b) Find the average speed from \(t = 2\) to \(t = 8\). Use the graph values \(s(2) \approx 0.38\,\text{mi}\) and \(s(8) \approx 2.12\,\text{mi}\). c) The cyclist’s instantaneous speed is greatest at the inflection point \(t = 5\). Use the tangent slope there to determine whether the cyclist ever travels faster than \(20\,\text{mph}\).
Figure for problem 532539

Hints

- Average speed is distance divided by time. - Convert minutes to hours before reporting miles per hour. - Instantaneous speed is the slope of the distance-time graph. - Use two convenient points on the tangent line at the steepest point.

Solution

1. Over the full ride, the cyclist travels \(2.5\,\text{mi}\) in \(10\) minutes, or \(\frac{1}{6}\) hour. The average speed is \(\frac{2.5}{1/6} = 15\,\text{mph}\). 2. From \(t = 2\) to \(t = 8\), the cyclist travels approximately \(2.12 - 0.38 \approx 1.74\,\text{mi}\) in \(6\) minutes, or \(0.1\) hour. The average speed is approximately \(\frac{1.74}{0.1} \approx 17.4\,\text{mph}\). 3. The tangent at \(t = 5\) passes through approximately \((1, 0)\) and \((9, 2.5)\). Its slope is \(\frac{2.5 - 0}{9 - 1} \approx 0.3125\,\frac{\text{mi}}{\text{min}}\). Converting gives \(0.3125 \cdot 60 \approx 18.75\,\text{mph}\). Since this is the maximum instantaneous speed, the cyclist never exceeds \(20\,\text{mph}\).

Answer

a) \(15\,\text{mph}\) b) Approximately \(17.4\,\text{mph}\) c) No. The maximum instantaneous speed is approximately \(18.75\,\text{mph}\).
53365912
Match each graph to the card showing its difference quotient. Verify each match by reading two graph points and calculating the average rate of change. **Cards:** * Card A: \(\frac{0.8 - (-0.2)}{3 - (-2)} = 0.2\) * Card B: \(\frac{0.5 - 2}{4 - 1} = -0.5\) * Card C: \(\frac{2 - 0}{2 - 0} = 1\)
Figure for problem 533659

Hints

- A difference quotient has the form \(\frac{y_2 - y_1}{x_2 - x_1}\). - Find graph points matching the numerator and denominator values. - A negative result means the graph decreases on average over the interval. - Check that the selected points lie exactly on the graphs.

Solution

1. Graph 1 passes through \((-2, -0.2)\) and \((3, 0.8)\). Its average rate is \(\frac{0.8 - (-0.2)}{3 - (-2)} = \frac{1}{5} = 0.2\), so it matches Card A. 2. Graph 2 passes through \((1, 2)\) and \((4, 0.5)\). Its average rate is \(\frac{0.5 - 2}{4 - 1} = \frac{-1.5}{3} = -0.5\), so it matches Card B. 3. Graph 3 passes through \((0, 0)\) and \((2, 2)\). Its average rate is \(\frac{2 - 0}{2 - 0} = 1\), so it matches Card C.

Answer

Graph 1: Card A Graph 2: Card B Graph 3: Card C
53366012
The figure shows four graphs labeled 1 through 4. Match each graph to the card that describes its average rate of change over the indicated interval. Justify each match by reading the endpoint coordinates. Card A: \(\frac{2-(-1)}{2-0}=1.5\) Card B: \(\frac{1-3}{2-0}=-1\) Card C: \(\frac{0-0}{3-1}=0\) Card D: \(\frac{2-0}{3-(-1)}=0.5\)
Figure for problem 533660

Hints

- The denominator gives the change in the x-coordinates. - The numerator gives the change in the y-coordinates. - A zero average rate means the two endpoint function values are equal. - Use whether each secant slope is positive, negative, or zero to eliminate cards.

Solution

1. Graph 1 contains \((0, -1)\) and \((2, 2)\), so its average rate is \(\frac{2 - (-1)}{2 - 0} = 1.5\). It matches Card A. 2. Graph 2 contains \((0, 3)\) and \((2, 1)\), so its average rate is \(\frac{1 - 3}{2 - 0} = -1\). It matches Card B. 3. Graph 3 contains \((1, 0)\) and \((3, 0)\), so its average rate is \(0\). It matches Card C. 4. Graph 4 contains \((-1, 0)\) and \((3, 2)\), so its average rate is \(\frac{2 - 0}{3 - (-1)} = 0.5\). It matches Card D.

Answer

Graph 1: Card A Graph 2: Card B Graph 3: Card C Graph 4: Card D
53367412
The graph of \(f\) includes tangent lines at \(P(2, 2)\) and \(Q(-2, -2)\). a) Use the tangent lines to find \(f'(2)\) and \(f'(-2)\). b) Estimate the slope of the graph at \(C(1, 4)\) and \(D(4, 1)\).
Figure for problem 533674

Hints

- A line that falls from left to right has negative slope. - Use two readable points on each drawn tangent line. - Imagine tangent lines at \(C\) and \(D\) to compare their steepness. - Check that the estimated slope at \(C\) is more negative than at \(D\).

Solution

1. The tangent at \(P\) passes through \((0, 4)\) and \((4, 0)\). Its slope is \(\frac{0-4}{4-0} = -1\), so \(f'(2) = -1\). 2. The tangent at \(Q\) passes through \((-4, 0)\) and \((0, -4)\). Its slope is \(\frac{-4-0}{0-(-4)} = -1\), so \(f'(-2) = -1\). 3. Near \(C(1, 4)\), the graph falls about \(4\) units for each unit of run, so the slope is \(\approx -4\). 4. Near \(D(4, 1)\), the graph falls about \(1\) unit for every \(4\) units of run, so the slope is \(\approx -0.25\).

Answer

a) \(f'(2) = -1\) and \(f'(-2) = -1\) b) At \(C\): \(\approx -4\); at \(D\): \(\approx -0.25\)
53391912
The graph shows a function \(f\) and two transformed functions \(g\) and \(h\). Function \(g\) is a vertical translation of \(f\), and \(h\) is a horizontal translation of \(f\). 1. Use the dashed tangent to find the slope of \(f\) at \(x=3\). 2. Explain why \(g\) has the same slope as \(f\) at \(x=3\). 3. At what x-value does \(h\) have the same slope that \(f\) has at \(x=3\)? Explain.
Figure for problem 533919

Hints

- Use a slope triangle on the dashed tangent. - Think about whether a vertical translation changes a graph’s steepness. - A horizontal translation moves the entire pattern of slopes by the same amount.

Solution

1. Along the tangent, a run of \(1\) corresponds to a rise of \(1\), so the slope of \(f\) at \(x=3\) is \(1\). 2. A vertical translation changes every y-value by the same constant but does not change tangent slopes. Therefore, \(g\) also has slope \(1\) at \(x=3\). 3. Function \(h\) is \(f\) shifted \(2\) units to the right. Its entire slope pattern shifts right by \(2\), so the corresponding slope occurs at \(x=5\).

Answer

1. The slope is \(1\). 2. A vertical translation does not change slopes at corresponding x-values. 3. \(x=5\)
53413412
The graphs of \(f\) and \(g\) are shown. Find the average rate of change of each function on each interval. a) \([-2, 0]\) b) \([0, 4]\)
Figure for problem 534134

Hints

- The average rate of change is the slope of the line through the two endpoint points. - Make a table of the values of both functions at \(x = -2\), \(x = 0\), and \(x = 4\). - Be careful when subtracting negative values.

Solution

1. For \(f\), read \(f(-2) = 0\), \(f(0) = -1\), and \(f(4) = 3\). 2. On \([-2, 0]\), the average rate for \(f\) is \(\frac{-1-0}{0-(-2)} = -0.5\). On \([0, 4]\), it is \(\frac{3-(-1)}{4-0} = 1\). 3. For \(g\), read \(g(-2) = -2\), \(g(0) = 2\), and \(g(4) = -2\). 4. On \([-2, 0]\), the average rate for \(g\) is \(\frac{2-(-2)}{0-(-2)} = 2\). On \([0, 4]\), it is \(\frac{-2-2}{4-0} = -1\).

Answer

a) \(f: -0.5\); \(g: 2\) b) \(f: 1\); \(g: -1\)
53414212
The graph models the motion of a remote-controlled car. It shows distance traveled \(s\), in meters, as a function of time \(t\), in seconds. a) Find the average speed on \([0, 10]\). b) Find the average speed on \([10, 20]\). c) Explain the difference between the two values using the shape of the graph.
Figure for problem 534142

Hints

- In a distance-time graph, what does slope represent? - Calculate the slope through the two endpoint points for each interval. - Compare the steepness of the graph over the two intervals. - Pay attention to the axis scales.

Solution

1. On \([0, 10]\), the graph gives \(s(0) = 0\,\text{m}\) and \(s(10) = 5\,\text{m}\). The average speed is \(\frac{5-0}{10-0} = 0.5\,\frac{\text{m}}{\text{s}}\). 2. On \([10, 20]\), the graph gives \(s(10) = 5\,\text{m}\) and \(s(20) = 20\,\text{m}\). The average speed is \(\frac{20-5}{20-10} = 1.5\,\frac{\text{m}}{\text{s}}\). 3. The second average speed is three times the first. The graph is steeper on \([10, 20]\), and its upward curvature indicates that the car is speeding up.

Answer

a) \(0.5\,\frac{\text{m}}{\text{s}}\) b) \(1.5\,\frac{\text{m}}{\text{s}}\) c) The second value is larger because the distance-time graph is steeper on \([10, 20]\). The upward curvature shows that the car is speeding up.
53414312
A water tank is filled over \(10\) minutes. The graph shows the volume of water in liters. a) Find the average inflow rate over the full \(10\)-minute period, in liters per minute. b) During which shown interval—\([0, 2]\), \([2, 5]\), \([5, 8]\), or \([8, 10]\)—was the average inflow rate greatest? Calculate that rate. c) What would have to happen for the graph to have a negative slope over an interval?
Figure for problem 534143

Hints

- Average rate of change is the slope of a secant line. - The units are volume per unit of time. - Compare the slopes of the graph over the four intervals. - What does decreasing water volume mean physically?

Solution

1. Over the full interval, the volume changes by \(400-50 = 350\,\text{L}\) in \(10\) minutes. The average inflow rate is \(\frac{350}{10} = 35\,\frac{\text{L}}{\text{min}}\). 2. On \([0, 2]\), the average rate is \(\frac{120-50}{2-0} = 35\,\frac{\text{L}}{\text{min}}\). 3. On \([2, 5]\), the average rate is \(\frac{200-120}{5-2} = \frac{80}{3}\,\frac{\text{L}}{\text{min}} \approx 26.67\,\frac{\text{L}}{\text{min}}\). 4. On \([5, 8]\), the average rate is \(\frac{350-200}{8-5} = 50\,\frac{\text{L}}{\text{min}}\). 5. On \([8, 10]\), the average rate is \(\frac{400-350}{10-8} = 25\,\frac{\text{L}}{\text{min}}\). Therefore, the greatest rate occurs on \([5, 8]\). 6. A negative slope would mean the water volume is decreasing, so the outflow and other losses would have to exceed the inflow.

Answer

a) \(35\,\frac{\text{L}}{\text{min}}\) b) \([5, 8]\), with an average rate of \(50\,\frac{\text{L}}{\text{min}}\) c) The volume would need to decrease; for example, outflow and other losses could exceed inflow.
53414412
Match each difference-quotient card to Graph 1, 2, or 3. Justify each match by identifying the corresponding points on the graph. **Card A:** \(\frac{5-0}{5-0} = 1\) **Card B:** \(\frac{2-2}{2-(-2)} = 0\) **Card C:** \(\frac{1-4}{4-1} = -1\)
Figure for problem 534144

Hints

- Interpret the numbers in each numerator and denominator as endpoint coordinates. - Look for graph points with those exact ordered pairs. - The quotient is the slope of the secant line through the two points. - Use whether the slope is positive, negative, or zero to narrow the choices.

Solution

1. Card A uses the points \((0, 0)\) and \((5, 5)\). Both lie on Graph 1, since its function is \(f(x) = 0.2x^2\). Therefore, Card A matches Graph 1. 2. Card B uses the points \((-2, 2)\) and \((2, 2)\). Both lie on Graph 2, and their equal y-coordinates produce a horizontal secant line. Therefore, Card B matches Graph 2. 3. Card C uses the points \((1, 4)\) and \((4, 1)\). Both lie on Graph 3, whose function is \(h(x) = \frac{4}{x}\). Therefore, Card C matches Graph 3.

Answer

Card A: Graph 1 Card B: Graph 2 Card C: Graph 3
53414512
Two function graphs and two difference-quotient cards are shown. Match each card to a graph, and explain how the card’s average rate of change appears on that graph. **Card A:** \(\frac{6-1.5}{4-2} = 2.25\) **Card B:** \(\frac{1-2}{3-0} = -\frac{1}{3}\)
Figure for problem 534145

Hints

- Use \(m = \frac{y_2-y_1}{x_2-x_1}\). - The numerator values are function values at the x-values shown in the denominator. - First use the sign of each slope to identify an increasing or decreasing graph. - Then verify the exact endpoint coordinates on the grid.

Solution

1. Card A uses the points \((2, 1.5)\) and \((4, 6)\). These points lie on Graph 1. The quotient \(2.25\) is the slope of the secant line through them. 2. Card B uses the points \((0, 2)\) and \((3, 1)\). These points lie on Graph 2. The quotient \(-\frac{1}{3}\) is the negative slope of the secant line through them, consistent with the graph decreasing on that interval.

Answer

Card A: Graph 1 Card B: Graph 2
53415212
The graph shows the water depth \(h\) in a rain barrel during a \(12\)-hour period that includes a heavy rainstorm. a) Describe how the water depth changes over time. b) Find the average rate of change on \([0, 4]\), \([4, 8]\), and \([8, 12]\). Include appropriate units. c) Interpret each value and its sign in context. What might have happened during each time period?
Figure for problem 534152

Hints

- Identify what the horizontal and vertical axes represent. - Average rate of change is the slope of a secant line through two graph points. - Subtract the endpoint water depths in the numerator and the endpoint times in the denominator. - What do positive, zero, and negative rates mean for the amount of water?

Solution

1. During the first \(4\) hours, the water depth rises from \(4\) inches to \(16\) inches. It remains constant from hour \(4\) through hour \(8\), then falls to \(8\) inches by hour \(12\). 2. On \([0, 4]\), the average rate is \(\frac{16-4}{4-0} = 3\,\frac{\text{in.}}{\text{h}}\). 3. On \([4, 8]\), the average rate is \(\frac{16-16}{8-4} = 0\,\frac{\text{in.}}{\text{h}}\). 4. On \([8, 12]\), the average rate is \(\frac{8-16}{12-8} = -2\,\frac{\text{in.}}{\text{h}}\). 5. The positive rate suggests net inflow, such as rain. The zero rate means no net change; inflow and outflow may have balanced. The negative rate indicates net outflow, possibly from use, drainage, or a leak.

Answer

a) The water depth rises, stays constant, and then falls. b) \([0, 4]\): \(3\,\frac{\text{in.}}{\text{h}}\); \([4, 8]\): \(0\,\frac{\text{in.}}{\text{h}}\); \([8, 12]\): \(-2\,\frac{\text{in.}}{\text{h}}\) c) Positive means net inflow, zero means no net change, and negative means net outflow.
53415312
A runner records a training route with a fitness app. The distance-time graph shows distance \(s\), in miles, as a function of time \(t\), in minutes. a) Find the runner’s average speed on \([0, 20]\), \([20, 30]\), and \([30, 40]\), in miles per hour. b) During which interval was the runner fastest on average? Explain how you can tell directly from the graph without calculating. c) A friend says, “You ran exactly \(4\) miles in \(40\) minutes, so you will run \(8\) miles in exactly \(80\) minutes.” Evaluate this claim using the graph.
Figure for problem 534153

Hints

- Average speed is the average rate of change of distance with respect to time. - Convert miles per minute to miles per hour by multiplying by \(60\). - A steeper distance-time graph indicates a greater speed. - For part c, decide whether the graph supports a constant pace.

Solution

1. On \([0, 20]\), the average speed is \(\frac{2.25-0}{20-0} = 0.1125\,\frac{\text{mi}}{\text{min}}\). Converting to miles per hour gives \(0.1125 \cdot 60 = 6.75\,\text{mph}\). 2. On \([20, 30]\), the average speed is \(\frac{3-2.25}{30-20} = 0.075\,\frac{\text{mi}}{\text{min}}\), or \(4.5\,\text{mph}\). 3. On \([30, 40]\), the average speed is \(\frac{4-3}{40-30} = 0.1\,\frac{\text{mi}}{\text{min}}\), or \(6\,\text{mph}\). 4. The runner was fastest on average during \([0, 20]\). The secant line through that interval’s endpoints is the steepest of the three. 5. The friend’s statement is only a projection based on the overall average speed. The graph shows that the runner’s speed varies, so maintaining the same average pace for another \(4\) miles is not guaranteed.

Answer

a) \([0, 20]\): \(6.75\,\text{mph}\); \([20, 30]\): \(4.5\,\text{mph}\); \([30, 40]\): \(6\,\text{mph}\) b) \([0, 20]\), because its endpoint secant line is the steepest. c) The claim is not guaranteed. It assumes the overall average pace will remain the same even though the graph shows changing speeds.
53415512
The graph shows a periodic function \(h\) with marked points \(P\), \(Q\), \(R\), and \(S\). a) At which point is the instantaneous rate of change smallest, meaning the graph is decreasing most steeply? b) Order \(P\), \(Q\), \(R\), and \(S\) from greatest slope to smallest slope. c) What is the slope at \(R\)?
Figure for problem 534155

Hints

- At a local maximum or minimum, the tangent is horizontal. - Compare where the curve rises and falls most steeply. - A steep downward slope is a large negative number and is therefore small.

Solution

1. At \(Q\), the graph is increasing most steeply, so it has the greatest positive slope. 2. At \(R\), the graph has a local maximum, so its tangent is horizontal and its slope is \(0\). 3. At \(P\), the graph is decreasing only slightly, so its slope is a small negative value. 4. At \(S\), the graph is decreasing most steeply, so it has the most negative and therefore smallest slope. 5. From greatest to smallest slope, the order is \(Q, R, P, S\).

Answer

a) \(S\) b) \(Q, R, P, S\) c) The slope at \(R\) is \(0\).
53416312
The temperature of a cup of coffee is modeled by a function \(T\), where \(t\) is the number of minutes after the coffee is poured and \(T(t)\) is measured in degrees Fahrenheit. a) Use the drawn tangent line to estimate the instantaneous cooling rate after \(10\) minutes, and explain your method. b) Explain how the graph shows that the coffee cools more slowly as time passes.
Figure for problem 534163

Hints

- Instantaneous rate of change is estimated with a tangent-line slope. - Use two convenient grid points close to the drawn tangent line. - Interpret the negative sign in the temperature context. - Compare how steep the graph is early and late in the process.

Solution

1. The drawn tangent line represents the instantaneous rate of change at \(t = 10\). 2. It passes near the readable grid points \((0, 160)\) and \((20, 80)\). 3. Its slope is approximately \(\frac{80-160}{20-0} = -4.0\,\frac{{}^\circ\text{F}}{\text{min}}\). Thus, the instantaneous temperature rate is \(\approx -4.0\,\frac{{}^\circ\text{F}}{\text{min}}\). 4. The negative value means the coffee is cooling at about \(4.0\) degrees Fahrenheit per minute after \(10\) minutes. 5. The graph becomes flatter as time increases, so the magnitude of its negative tangent slopes decreases. Therefore, the cooling rate slows over time.

Answer

a) The instantaneous temperature rate is \(\approx -4.0\,\frac{{}^\circ\text{F}}{\text{min}}\), so the coffee is cooling at about \(4.0\) degrees Fahrenheit per minute. b) The graph becomes flatter over time, so the magnitude of the negative slope decreases.
53416412
A water tank is being filled. The function \(V(t)\) gives the water volume in gallons after \(t\) minutes. a) Use the drawn tangent line to estimate the instantaneous inflow rate at \(t = 4\) minutes. b) Use the shape of the graph to decide whether the inflow rate increases or decreases over time.
Figure for problem 534164

Hints

- Use the drawn tangent line to estimate the rate at one time. - Calculate the tangent slope from two readable points. - Observe whether the curve becomes steeper or flatter from left to right.

Solution

1. The instantaneous inflow rate at \(t = 4\) is the slope of the drawn tangent line at \((4, 4)\). 2. The tangent line passes through \((0, 2)\) and \((12, 8)\). 3. Its slope is \(\frac{8-2}{12-0} = \frac{6}{12} = 0.5\,\frac{\text{gal}}{\text{min}}\). 4. The graph becomes flatter as time increases, so its tangent slopes decrease. Therefore, the inflow rate decreases over time.

Answer

a) \(\approx 0.5\,\frac{\text{gal}}{\text{min}}\) b) The inflow rate decreases because the graph becomes flatter over time.
53416512
The graph shows the temperature \(T\), in degrees Fahrenheit, during a sunny morning. The variable \(t\) is the number of hours since measurements began at 6:00 a.m. 1. Use the graph to find \(T(0)\) and \(T(6)\). 2. Calculate \(\frac{T(6)-T(0)}{6-0}\). 3. Explain the meaning of this value in context and include the correct units. 4. Use the tangent line shown at \(t = 2\) to estimate the instantaneous rate of change of the temperature.
Figure for problem 534165

Hints

- Locate the graph points at the requested times. - The difference quotient is the slope of a secant line. - When time is on the horizontal axis, slope describes change per unit of time. - For the instantaneous rate, use two readable points on the shown tangent line to estimate its slope.

Solution

1. From the graph, \(T(0) = 40\,{}^\circ\text{F}\) and \(T(6) = 64\,{}^\circ\text{F}\). 2. The difference quotient is \(\frac{64-40}{6-0} = \frac{24}{6} = 4\). 3. From 6:00 a.m. to noon, the temperature increased by an average of \(4\,{}^\circ\text{F}\) per hour. 4. The shown tangent line passes through readable points such as \((0, 42)\) and \((2, 52)\), so its slope is \(\frac{52-42}{2-0} = 5\,\frac{{}^\circ\text{F}}{\text{h}}\). Thus the instantaneous rate of change at \(t = 2\) is approximately \(5\,\frac{{}^\circ\text{F}}{\text{h}}\).

Answer

1. \(T(0) = 40\,{}^\circ\text{F}\); \(T(6) = 64\,{}^\circ\text{F}\) 2. \(4\) 3. The average warming rate was \(4\,\frac{{}^\circ\text{F}}{\text{h}}\) from 6:00 a.m. to noon. 4. Approximately \(5\,\frac{{}^\circ\text{F}}{\text{h}}\)
53416612
The graph of \(g\) is shown. 1. Find the average rate of change of \(g\) on \([0, 5]\). 2. Find the instantaneous rate of change at \(x = 3\). 3. State the geometric meaning of the values from parts 1 and 2. 4. At what x-value in \([0, 5]\) is the instantaneous rate of change greatest? Briefly justify your answer.
Figure for problem 534166

Hints

- Average rate of change uses only the endpoints of the interval. - Look for a special feature of the graph at \(x = 3\). - Recall the geometric meanings of secant and tangent slopes. - Find where the graph rises most steeply.

Solution

1. Read the endpoint values: \(g(0) = 3\) and \(g(5) = 5\). 2. The average rate of change is \(\frac{g(5)-g(0)}{5-0} = \frac{5-3}{5} = 0.4\). 3. At \(x = 3\), the graph has a local minimum, so the tangent is horizontal and \(g'(3) = 0\). 4. The value \(0.4\) is the slope of the secant line through \((0, 3)\) and \((5, 5)\). The value \(0\) is the slope of the tangent line at \(x = 3\). 5. The graph is increasing most steeply at the right endpoint, \(x = 5\), so the instantaneous rate of change is greatest there.

Answer

1. \(0.4\) 2. \(0\) 3. Part 1 is a secant-line slope; part 2 is a tangent-line slope. 4. \(x = 5\)
53416712
The graph shows the height \(h\), in meters, of a weather balloon as a function of time \(t\), in minutes. Estimate the instantaneous rate of change at each marked time by comparing the curve's local steepness. Match each time with one possible rate. Times: \(t_1=0\) \(t_2=2\) \(t_3=4\) \(t_4=5\) Possible rates: A. \(-1.8\,\frac{\text{m}}{\text{min}}\) B. \(-1.0\,\frac{\text{m}}{\text{min}}\) C. \(-0.2\,\frac{\text{m}}{\text{min}}\) D. \(0.5\,\frac{\text{m}}{\text{min}}\) E. \(1.5\,\frac{\text{m}}{\text{min}}\)
Figure for problem 534167

Hints

- A tangent-line slope gives the instantaneous rate of change. - First decide whether each slope is positive, negative, or nearly zero. - Then compare the steepness of the graph at the four marked points. - One listed value will not be used.

Solution

1. At \(t_1 = 0\), the graph is decreasing with a tangent slope of about \(-1.0\,\frac{\text{m}}{\text{min}}\). 2. At \(t_2 = 2\), the graph is decreasing more steeply, with a tangent slope of about \(-1.8\,\frac{\text{m}}{\text{min}}\). 3. At \(t_3 = 4\), the graph is nearly horizontal but still decreasing, with a tangent slope of about \(-0.2\,\frac{\text{m}}{\text{min}}\). 4. At \(t_4 = 5\), the graph is increasing, with a tangent slope of about \(1.5\,\frac{\text{m}}{\text{min}}\). 5. The value \(0.5\,\frac{\text{m}}{\text{min}}\) is not used.

Answer

\(t_1=0 \rightarrow -1.0\,\frac{\text{m}}{\text{min}}\) \(t_2=2 \rightarrow -1.8\,\frac{\text{m}}{\text{min}}\) \(t_3=4 \rightarrow -0.2\,\frac{\text{m}}{\text{min}}\) \(t_4=5 \rightarrow 1.5\,\frac{\text{m}}{\text{min}}\) The value \(0.5\,\frac{\text{m}}{\text{min}}\) is not used.
53417212
The graph of \(f(x) = 0.1x^3+1\) is shown. We are investigating the instantaneous rate of change at \(P(1, 1.1)\). a) Find the slopes of the secant lines through \(P\) and \(Q(a,f(a))\) for the values of \(a\) in the table. Complete the last row. <table> <tr><th>\(a\)</th><td>\(2\)</td><td>\(1.5\)</td><td>\(1.1\)</td></tr> <tr><th>\(f(a)\)</th><td>\(1.8\)</td><td>\(1.3375\)</td><td>\(1.1331\)</td></tr> <tr><th>\(m_s\)</th><td>...</td><td>...</td><td>...</td></tr> </table> b) Predict the tangent-line slope at \(P\). Justify your prediction using the secant slopes.
Figure for problem 534172

Hints

- Use the slope formula with \(P(1, 1.1)\) as one endpoint each time. - Keep decimal places carefully when subtracting. - Look for a trend in the secant slopes as \(a\) approaches \(1\). - A secant line approaches a tangent line as its second point approaches \(P\).

Solution

1. Use \(m_s = \frac{f(a)-f(1)}{a-1}\), where \(f(1) = 1.1\). 2. For \(a = 2\): \(m_s = \frac{1.8-1.1}{2-1} = 0.7\). 3. For \(a = 1.5\): \(m_s = \frac{1.3375-1.1}{1.5-1} = \frac{0.2375}{0.5} = 0.475\). 4. For \(a = 1.1\): \(m_s = \frac{1.1331-1.1}{1.1-1} = \frac{0.0331}{0.1} = 0.331\). 5. As \(a\) approaches \(1\), the secant slopes \(0.7\), \(0.475\), and \(0.331\) approach \(0.3\). Therefore, predict that the tangent-line slope is \(0.3\).

Answer

a) \(0.7\), \(0.475\), \(0.331\) b) The tangent-line slope is \(\approx 0.3\).
53417712
The graph shows the elevation profile of a bike ride. Elevation \(h\), in feet, is plotted against horizontal distance \(s\), in miles. A tangent line is drawn at point \(P\). a) Interpret the local rate of change at \(P\) in context. b) Use the tangent line to find the grade at \(P\), first in feet per mile and then as a percentage. c) Estimate the local rate of change at the start, \(s = 0\), and at the highest point of the ride. Justify your estimates.
Figure for problem 534177

Hints

- Interpret the axes before describing the slope. - Use two points on the tangent line to calculate rise over run. - Convert miles to feet before calculating percent grade. - Horizontal tangents have slope \(0\).

Solution

1. The local rate of change at \(P\) is the instantaneous change in elevation for each mile of horizontal travel. 2. The tangent line passes through \((0, 40)\) and \(P(2, 520)\). Its slope is \(\frac{520-40}{2-0} = 240\,\frac{\text{ft}}{\text{mi}}\). 3. One mile is \(5280\) feet, so the grade is \(\frac{240}{5280}\cdot 100\%\approx 4.5\%\). 4. At the start, the graph is horizontal, so the local rate is \(0\,\frac{\text{ft}}{\text{mi}}\). 5. At the highest point, \(s = 4\), the graph is also horizontal, so the local rate is \(0\,\frac{\text{ft}}{\text{mi}}\).

Answer

a) It is the instantaneous elevation gain per mile at \(P\). b) \(240\,\frac{\text{ft}}{\text{mi}}\), which is \(\approx 4.5\%\) c) \(0\,\frac{\text{ft}}{\text{mi}}\) at both \(s = 0\) and \(s = 4\)
53417812
A water tank is being filled. The graph shows the volume \(V\), in gallons, as a function of time \(t\), in minutes. a) Find the average inflow rate during the first \(20\) minutes. b) Use the drawn tangent line to estimate the instantaneous inflow rate at \(t = 10\) minutes. c) Compare the inflow rates at \(t = 5\) and \(t = 25\). At which time is water entering the tank faster? Justify your answer from the graph.
Figure for problem 534178

Hints

- Average inflow rate is total volume change divided by elapsed time. - Estimate the instantaneous rate with the drawn tangent-line slope. - A steeper upward graph represents a greater inflow rate.

Solution

1. The average inflow rate on \([0, 20]\) is \(\frac{V(20)-V(0)}{20-0} = \frac{40-0}{20} = 2\,\frac{\text{gal}}{\text{min}}\). 2. At \(t = 10\), the point is \((10, 25)\). The drawn tangent passes through \((0, 5)\) and \((20, 45)\). 3. Its slope is \(\frac{45-5}{20-0} = 2\,\frac{\text{gal}}{\text{min}}\), so the instantaneous inflow rate is about \(2\,\frac{\text{gal}}{\text{min}}\). 4. The graph is steeper at \(t = 5\) than at \(t = 25\). Therefore, water is entering the tank faster at \(t = 5\).

Answer

a) \(2\,\frac{\text{gal}}{\text{min}}\) b) \(\approx 2\,\frac{\text{gal}}{\text{min}}\) c) Water enters faster at \(t = 5\) because the graph is steeper there.
53417912
The graph shows the temperature \(T(t)\), in degrees Celsius, of a chemical during a \(10\)-minute experiment. a) Find the maximum temperature and when it occurs. b) Use the drawn tangent lines to estimate the instantaneous temperature rates at \(t = 4\) and \(t = 6\). c) When is the substance cooling most rapidly? d) What does the instantaneous rate at \(t = 2\) mean for the temperature?
Figure for problem 534179

Hints

- Use each drawn tangent-line slope to estimate instantaneous temperature change. - The maximum is the highest point on the graph. - The fastest cooling occurs where the graph falls most steeply. - At the top of the graph, the tangent is horizontal.

Solution

1. The graph reaches its highest point at \(t = 2\), where \(T = 45\,{}^\circ\text{C}\). 2. At \(t = 4\), the tangent line passes through \((4, 40)\) and \((9, 25)\), so its slope is \(\frac{25-40}{9-4} = -3\,\frac{{}^\circ\text{C}}{\text{min}}\). 3. At \(t = 6\), the tangent line passes through \((6, 35)\) and \((11, 25)\), so its slope is \(\frac{25-35}{11-6} = -2\,\frac{{}^\circ\text{C}}{\text{min}}\). 4. The substance cools most rapidly where the graph has its steepest downward tangent, at about \(t \approx 3.5\) minutes. 5. At \(t = 2\), the tangent is horizontal, so the instantaneous rate is \(0\). The temperature is at a local maximum and is momentarily neither increasing nor decreasing.

Answer

a) \(45\,{}^\circ\text{C}\) at \(t = 2\,\text{min}\) b) At \(t = 4\): \(\approx -3\,\frac{{}^\circ\text{C}}{\text{min}}\); at \(t = 6\): \(\approx -2\,\frac{{}^\circ\text{C}}{\text{min}}\) c) At \(t \approx 3.5\,\text{min}\) d) The rate is \(0\), marking the maximum temperature.
53418512
The graph shows the water depth \(h\) in a stormwater retention basin during a heavy rainstorm. a) Use the drawn tangent line to find the instantaneous rate of change of the depth at \(t = 5\) hours. b) When is the instantaneous rate greatest? How is this point characterized on the graph? c) What does an instantaneous rate of \(0\,\frac{\text{m}}{\text{h}}\) mean in context?
Figure for problem 534185

Hints

- Use the drawn tangent-line slope for the instantaneous rate. - Look for the steepest upward part of the graph. - A zero rate corresponds to a horizontal tangent.

Solution

1. The drawn tangent at \(t = 5\) passes through \((3, 2)\) and \((7, 8)\). Its slope is \(\frac{8-2}{7-3} = 1.5\,\frac{\text{m}}{\text{h}}\). 2. The rate is greatest where the graph rises most steeply. This occurs at \(t = 5\), the inflection point. 3. A rate of \(0\,\frac{\text{m}}{\text{h}}\) means the water depth is momentarily constant. On this graph, it occurs at \(t = 0\) and at the maximum \(t = 10\).

Answer

a) \(1.5\,\frac{\text{m}}{\text{h}}\) b) At \(t = 5\) hours, the inflection point where the graph is steepest c) The water depth is momentarily neither rising nor falling.
53424012
The graph shows the elevation profile of a hiking trail. Horizontal distance is measured in miles, and elevation is measured in feet. a) Find the average grade, as a percent, for each section: - mile \(0\) to mile \(2\) - mile \(2\) to mile \(3.5\) - mile \(3.5\) to mile \(5.5\) b) A trail guide warns, “Although some average grades are moderate, the section from mile \(3.5\) to mile \(5.5\) contains short, steep stretches.” Explain this statement using the graph.
Figure for problem 534240

Hints

- Grade is vertical change divided by horizontal distance. - Convert miles to feet so both quantities use the same unit. - An average grade uses only the endpoints and may hide steeper portions inside the interval. - Compare a short subinterval in the third section with the entire section.

Solution

1. Use \(1\,\text{mi} = 5280\,\text{ft}\), and calculate grade as vertical change divided by horizontal distance. 2. From mile \(0\) to mile \(2\), the elevation change is \(900-500 = 400\,\text{ft}\), and the horizontal distance is \(10{,}560\,\text{ft}\). The average grade is \(\frac{400}{10{,}560}\cdot 100\% \approx 3.79\%\). 3. From mile \(2\) to mile \(3.5\), the elevation change is \(700-900 = -200\,\text{ft}\), and the horizontal distance is \(7920\,\text{ft}\). The average grade is \(\frac{-200}{7920}\cdot 100\% \approx -2.53\%\). 4. From mile \(3.5\) to mile \(5.5\), the elevation change is \(1550-700 = 850\,\text{ft}\), and the horizontal distance is \(10{,}560\,\text{ft}\). The average grade is \(\frac{850}{10{,}560}\cdot 100\% \approx 8.05\%\). 5. The section from mile \(4.5\) to mile \(5\) rises \(300\,\text{ft}\) over \(0.5\) mile, or \(2640\,\text{ft}\). Its average grade is \(\frac{300}{2640}\cdot 100\% \approx 11.36\%\), substantially steeper than the average over the full two-mile section.

Answer

a) Mile \(0\) to mile \(2\): approximately \(3.79\%\) Mile \(2\) to mile \(3.5\): approximately \(-2.53\%\) Mile \(3.5\) to mile \(5.5\): approximately \(8.05\%\) b) The full-section average hides local variation. From mile \(4.5\) to mile \(5\), the average grade is approximately \(11.36\%\), which is much steeper.
53424112
The graph shows the temperature during a sunny fall day from midnight to midnight. a) Find the average rate of change of the temperature, in degrees Fahrenheit per hour, from 4:00 a.m. to noon and from noon to 8:00 p.m. b) During what time period between midnight and midnight does the temperature appear to change fastest? Justify your answer using the graph.
Figure for problem 534241

Hints

- Average rate of change is change in temperature divided by elapsed time. - What does a negative temperature rate mean? - The fastest change occurs where the graph is steepest in either direction. - Compare the temperature changes over equal time intervals.

Solution

1. From 4:00 a.m. to noon, \(T(4) = 46\,{}^\circ\text{F}\) and \(T(12) = 74\,{}^\circ\text{F}\). The average rate is \(\frac{74-46}{12-4} = 3.5\,\frac{{}^\circ\text{F}}{\text{h}}\). 2. From noon to 8:00 p.m., \(T(12) = 74\,{}^\circ\text{F}\) and \(T(20) = 58\,{}^\circ\text{F}\). The average rate is \(\frac{58-74}{20-12} = -2\,\frac{{}^\circ\text{F}}{\text{h}}\). 3. The graph is steepest from about 8:00 a.m. to 10:00 a.m., when the temperature rises \(10\,{}^\circ\text{F}\) in \(2\) hours, an average of \(5\,{}^\circ\text{F}\) per hour. The evening drop is also steep, but its magnitude is smaller over the shown two-hour intervals.

Answer

a) 4:00 a.m. to noon: \(3.5\,\frac{{}^\circ\text{F}}{\text{h}}\) Noon to 8:00 p.m.: \(-2\,\frac{{}^\circ\text{F}}{\text{h}}\) b) Approximately 8:00 a.m. to 10:00 a.m., where the graph has the greatest slope magnitude.
53425112
The graph shows the distance \(s\), in feet, traveled by a vehicle during the first \(10\) seconds. 1. Use the drawn tangent line to estimate the instantaneous speed at \(t = 5\) seconds. 2. Convert the result to miles per hour. 3. Describe how the speed changes during the first \(10\) seconds. Justify your answer from the graph's curvature.
Figure for problem 534251

Hints

- Instantaneous speed is the tangent slope on a distance-time graph. - Use two readable points on the drawn tangent line. - Convert feet per second using \(1\,\text{mi}=5280\,\text{ft}\) and \(1\,\text{h}=3600\,\text{s}\). - A graph that becomes steeper represents increasing speed.

Solution

1. The drawn tangent at \(t = 5\) passes through \((6, 100)\) and \((10, 250)\). 2. Its slope is \(\frac{250-100}{10-6} = 37.5\,\frac{\text{ft}}{\text{s}}\). 3. Convert to miles per hour: \(37.5\cdot\frac{3600}{5280}\approx 25.6\,\frac{\text{mi}}{\text{h}}\). 4. The graph becomes steeper as time increases, so the instantaneous speed increases. Its concave-up shape indicates positive acceleration.

Answer

1. \(\approx 37.5\,\frac{\text{ft}}{\text{s}}\) 2. \(\approx 25.6\,\frac{\text{mi}}{\text{h}}\) 3. The speed increases because the graph becomes progressively steeper.
52216312
Let \(f(x) = x^2 - 4x\). a) Find the average rate of change of \(f\) over \(I_1 = [1, 5]\) and \(I_2 = [0, 6]\). b) Show that, for any \(a < b\) and \(k > 0\), the average rate of change of \(f\) over \([a, b]\) equals the average rate of change over \([a - k, b + k]\). c) Interpret this result geometrically in terms of secant lines to the parabola.

Hints

- Recall the difference-quotient formula. - What happens to an interval’s midpoint when both endpoints are moved outward by the same amount \(k\)? - Factor the difference of the quadratic expressions so that \(b - a\) cancels. - How are two lines related when they have the same slope?

Solution

1. Over \(I_1\), \(\frac{f(5) - f(1)}{5 - 1} = \frac{5 - (-3)}{4} = 2\). 2. Over \(I_2\), \(\frac{f(6) - f(0)}{6 - 0} = \frac{12 - 0}{6} = 2\). 3. Over \([a, b]\), \(\frac{f(b) - f(a)}{b - a} = \frac{b^2 - 4b - (a^2 - 4a)}{b - a} = \frac{(b - a)(a + b - 4)}{b - a} = a + b - 4\). 4. Over \([a - k, b + k]\), the sum of the endpoints is \((a - k) + (b + k) = a + b\). Applying the same simplification, the average rate of change is \((a - k) + (b + k) - 4 = a + b - 4\). 5. The corresponding secant lines have the same slope, so they are parallel. The two intervals have the same midpoint, and for this quadratic the secant slope depends only on the sum, or equivalently the midpoint, of the endpoints.

Answer

a) \(I_1\): \(2\) \(I_2\): \(2\) b) Both average rates simplify to \(a + b - 4\). c) The corresponding secant lines are parallel. For this quadratic, intervals with the same midpoint produce the same secant slope.
52904712
After a medication is taken, the amount of its active ingredient in a patient’s blood decreases continuously. The amount decreases by \(15\%\) every \(4\) hours. At \(t = 0\), the blood contains \(200\,\text{mg}\) of the active ingredient. a) Find a function in the form \(f(t) = ca^t\) that gives the amount \(f(t)\), in milligrams, after \(t\) hours. Determine \(c\) and \(a\). b) Interpret \(f(t) - f(t_0)\) and \(\frac{f(t) - f(t_0)}{t - t_0}\) in context. c) Find the average rate of change of the amount over \([0, 4]\) and \([12, 16]\).

Hints

- What factor remains after a quantity decreases by \(15\%\)? - Use the units of the numerator and denominator to interpret each expression. - Average rate of change is the slope of a secant line through two graph points. - Make sure the hourly factor \(a\) matches the fact that the stated percent decrease occurs every \(4\) hours.

Solution

1. The initial value is \(c = 200\). A \(15\%\) decrease every \(4\) hours gives \(f(4) = 200 \cdot 0.85\). From \(200a^4 = 200 \cdot 0.85\), \(a = \sqrt[4]{0.85} \approx 0.9603\). Thus, \(f(t) = 200(\sqrt[4]{0.85})^t\), or approximately \(f(t) = 200 \cdot 0.9603^t\). 2. The expression \(f(t) - f(t_0)\) is the net change in the amount, in milligrams, from time \(t_0\) to time \(t\). The quotient \(\frac{f(t) - f(t_0)}{t - t_0}\) is the average rate of change over that interval, in milligrams per hour. 3. Over \([0, 4]\), \(f(0) = 200\) and \(f(4) = 170\), so the average rate is \(\frac{170 - 200}{4} = -7.5\,\frac{\text{mg}}{\text{h}}\). 4. Over \([12, 16]\), \(f(12) = 200 \cdot 0.85^3 = 122.825\) and \(f(16) = 200 \cdot 0.85^4 = 104.40125\). The average rate is \(\frac{104.40125 - 122.825}{4} \approx -4.6059\,\frac{\text{mg}}{\text{h}}\).

Answer

a) \(c = 200\), \(a = \sqrt[4]{0.85} \approx 0.9603\), and \(f(t) = 200(\sqrt[4]{0.85})^t\) b) \(f(t) - f(t_0)\) is the net change in milligrams; \(\frac{f(t) - f(t_0)}{t - t_0}\) is the average change in milligrams per hour. c) \([0, 4]\): \(-7.5\,\frac{\text{mg}}{\text{h}}\) \([12, 16]\): approximately \(-4.6059\,\frac{\text{mg}}{\text{h}}\)

All problems may be used, copied and printed free of charge for school and tutoring, including paid tutoring. Commercial adaptations as well as publication or redistribution on the internet are not permitted.

