Aimathic
Login | English | Deutsch

Free math worksheets

Build your own math worksheets from 30,000+ problems for grades 3 to 12, from fractions to AP Calculus. Every problem comes with step-by-step solutions.

Introduction to area accumulation

Click problems to add them to your worksheet.

55145712
The graph shows a constant water-flow rate of \(3\,\frac{\text{L}}{\text{s}}\) for \(4\) seconds. Use the rectangular area under the rate graph to find how much water accumulates during the interval.
Figure for problem 551457

Hints

- Identify the width and height of the shaded rectangle. - Multiply rate by elapsed time. - Check how the time units cancel in the product.

Solution

1. The area under a constant rate graph is a rectangle. 2. Its width is \(4\,\text{s}\) and its height is \(3\,\frac{\text{L}}{\text{s}}\). 3. The accumulated amount is \(4\,\text{s}\cdot 3\,\frac{\text{L}}{\text{s}}=12\,\text{L}\).

Answer

\(12\,\text{L}\)
55145812
A pump runs at the piecewise-constant rate shown in the graph: \(2\,\frac{\text{gal}}{\text{min}}\) for the first \(2\) minutes and \(5\,\frac{\text{gal}}{\text{min}}\) for the next minute. Find the total amount pumped during the \(3\)-minute interval.
Figure for problem 551458

Hints

- Split the graph where the rate changes. - Find the rectangular area for each constant-rate interval. - Add the two accumulated amounts and keep the resulting quantity in gallons.

Solution

1. During the first \(2\) minutes, the rectangular area is \(2\,\text{min}\cdot 2\,\frac{\text{gal}}{\text{min}}=4\,\text{gal}\). 2. During the next \(1\) minute, the rectangular area is \(1\,\text{min}\cdot 5\,\frac{\text{gal}}{\text{min}}=5\,\text{gal}\). 3. Add the accumulated amounts: \(4\,\text{gal}+5\,\text{gal}=9\,\text{gal}\).

Answer

\(9\,\text{gal}\)
55145912
A moving cart has the measured speeds shown below. <table><tr><th>Time \((\text{s})\)</th><th>Speed \((\text{m}/\text{s})\)</th></tr><tr><td>\(0\)</td><td>\(2\)</td></tr><tr><td>\(1\)</td><td>\(3\)</td></tr><tr><td>\(2\)</td><td>\(5\)</td></tr><tr><td>\(3\)</td><td>\(4\)</td></tr></table> Estimate the distance traveled from \(t=0\) to \(t=3\) using three \(1\)-second rectangles whose heights are the speeds at the left endpoints.

Hints

- Match each time interval with the speed at its left endpoint. - Every rectangle has the same width here. - Multiply each speed by its interval width, then add the resulting distances.

Solution

1. The three intervals are \([0,1]\), \([1,2]\), and \([2,3]\), each with width \(1\,\text{s}\). 2. The left-endpoint speeds are \(2\), \(3\), and \(5\,\frac{\text{m}}{\text{s}}\). 3. The estimate is \(1\cdot 2+1\cdot 3+1\cdot 5=10\,\text{m}\).

Answer

\(10\,\text{m}\)
55146012
The graph shows a decreasing inflow rate over \(4\) minutes. The shaded rectangles use the rate at the right endpoint of each \(1\)-minute interval. a) Use the shaded rectangles to estimate the accumulated inflow. b) A left-endpoint estimate with the same four intervals is \(18\,\text{L}\). Explain why the right-endpoint estimate is smaller.
Figure for problem 551460

Hints

- Read the height of each shaded rectangle from the graph. - Every rectangle has width \(1\) minute. - Think about whether a decreasing graph lies above or below a rectangle whose height is chosen at the right edge.

Solution

a) The right-endpoint rectangle heights are \(5\), \(4\), \(3\), and \(2\,\frac{\text{L}}{\text{min}}\). With width \(1\,\text{min}\), the estimate is \(5+4+3+2=14\,\text{L}\). b) Because the rate decreases throughout the interval, each right-endpoint height is below the graph over most of its rectangle, while each left-endpoint height is above the graph over most of its rectangle. Therefore the right-endpoint estimate is smaller.

Answer

a) \(14\,\text{L}\) b) For a decreasing rate, right-endpoint rectangles lie below the graph while left-endpoint rectangles lie above it, so the right-endpoint estimate is smaller.
55146112
A machine fills a container at the piecewise-constant rates shown in the table. <table><tr><th>Time interval \((\text{min})\)</th><th>Rate \((\text{L}/\text{min})\)</th></tr><tr><td>\([0,1]\)</td><td>\(4\)</td></tr><tr><td>\([1,2.5]\)</td><td>\(2\)</td></tr><tr><td>\([2.5,4]\)</td><td>\(5\)</td></tr></table> Find the total amount accumulated from \(t=0\) to \(t=4\).

Hints

- Find the width of each time interval before multiplying by its rate. - The intervals do not all have the same width. - Add the accumulated amounts from the three intervals.

Solution

1. On \([0,1]\), the accumulated amount is \(1\cdot 4=4\,\text{L}\). 2. On \([1,2.5]\), the interval width is \(1.5\) minutes, so the amount is \(1.5\cdot 2=3\,\text{L}\). 3. On \([2.5,4]\), the interval width is also \(1.5\) minutes, so the amount is \(1.5\cdot 5=7.5\,\text{L}\). 4. The total is \(4+3+7.5=14.5\,\text{L}\).

Answer

\(14.5\,\text{L}\)
55146212
A cart moves forward with the velocity shown in the graph. The velocity is never negative. Use geometric areas between the velocity graph and the time axis to find the distance traveled from \(t=0\) to \(t=6\) seconds.
Figure for problem 551462

Hints

- Split the region under the graph where its shape changes. - Identify the familiar geometric shape in each section. - Because velocity is nonnegative, each geometric area contributes positively to distance traveled.

Solution

1. From \(0\) to \(2\) seconds, the region is a triangle with area \(\frac{1}{2}\cdot 2\cdot 4=4\,\text{m}\). 2. From \(2\) to \(5\) seconds, the region is a rectangle with area \(3\cdot 4=12\,\text{m}\). 3. From \(5\) to \(6\) seconds, the region is a triangle with area \(\frac{1}{2}\cdot 1\cdot 4=2\,\text{m}\). 4. The total distance is \(4+12+2=18\,\text{m}\).

Answer

\(18\,\text{m}\)
55146312
The graph shows a liquid-flow rate that increases linearly from \(2\,\frac{\text{L}}{\text{min}}\) to \(6\,\frac{\text{L}}{\text{min}}\) during \(4\) minutes. Use the area of the trapezoid under the graph to find the volume added.
Figure for problem 551463

Hints

- Identify the two parallel vertical heights of the trapezoid. - Use the horizontal time interval as the trapezoid’s width. - Check the units produced by rate multiplied by time.

Solution

1. The region under the rate graph is a trapezoid whose parallel sides have lengths \(2\) and \(6\), and whose width is \(4\) minutes. 2. Its area is \(\frac{2+6}{2}\cdot 4=16\). 3. Multiplying \(\frac{\text{L}}{\text{min}}\) by minutes gives liters, so the volume added is \(16\,\text{L}\).

Answer

\(16\,\text{L}\)
55146412
A process runs at a constant rate on each interval shown below. The middle rate is unknown. <table><tr><th>Time interval \((\text{h})\)</th><th>Rate \((\text{units}/\text{h})\)</th></tr><tr><td>\([0,2]\)</td><td>\(3\)</td></tr><tr><td>\([2,5]\)</td><td>\(r\)</td></tr></table> The total accumulated amount over the \(5\) hours is \(18\) units. Find \(r\).

Hints

- Convert each constant-rate interval into a rectangular accumulated amount. - Express the unknown interval’s contribution in terms of \(r\). - The two interval contributions must add to the stated total.

Solution

1. The first interval contributes \(2\cdot 3=6\) units. 2. The second interval has width \(3\) hours, so it contributes \(3r\) units. 3. Use the total: \(6+3r=18\). 4. Then \(3r=12\), so \(r=4\,\frac{\text{units}}{\text{h}}\).

Answer

\(r=4\,\frac{\text{units}}{\text{h}}\)
55146512
A positive rate follows \(r(t)=t^2+1\) from \(t=0\) to \(t=2\). The graph shows the increasing curve. a) Use two left-endpoint rectangles of width \(1\) to estimate the accumulated amount. b) Use four left-endpoint rectangles of width \(0.5\) to make a refined estimate. c) Explain why the refined left-endpoint estimate is larger.
Figure for problem 551465

Hints

- List the left endpoints for each partition before evaluating the rate. - Multiply each sampled rate by the common rectangle width. - For an increasing graph, compare each left-endpoint rectangle height with the curve over that interval.

Solution

a) With width \(1\), the left endpoints are \(0\) and \(1\). The estimate is \(1[r(0)+r(1)]=1(1+2)=3\). b) With width \(0.5\), the left endpoints are \(0\), \(0.5\), \(1\), and \(1.5\). The corresponding rates are \(1\), \(1.25\), \(2\), and \(3.25\). The estimate is \(0.5(1+1.25+2+3.25)=3.75\). c) The rate is increasing, so left-endpoint rectangles lie below the curve. Refining the partition replaces some coarse rectangle heights with larger later values, producing a larger lower estimate.

Answer

a) \(3\) b) \(3.75\) c) Because the rate is increasing, both are lower estimates, and the finer left-endpoint partition gives the larger one.
55146612
The graph shows an increasing rate at \(t=0,1,2,3\), with values \(1,2,4,7\) units per minute. Assume the rate remains increasing between the marked times. Use three \(1\)-minute rectangles to find a lower bound and an upper bound for the amount accumulated from \(t=0\) to \(t=3\).
Figure for problem 551466

Hints

- Decide which endpoint gives the smaller height on each interval when the rate is increasing. - All three rectangles have width \(1\) minute. - Use one set of endpoint heights for the lower bound and the other set for the upper bound.

Solution

1. Because the rate is increasing, left-endpoint rectangles give a lower bound. Their heights are \(1\), \(2\), and \(4\), so the lower bound is \(1+2+4=7\) units. 2. Right-endpoint rectangles give an upper bound. Their heights are \(2\), \(4\), and \(7\), so the upper bound is \(2+4+7=13\) units. 3. Thus the accumulated amount lies between \(7\) and \(13\) units under the stated monotonicity assumption.

Answer

Lower bound: \(7\) units Upper bound: \(13\) units
55146712
Two machines have the rate graphs shown for the same \(4\)-minute interval. Both start at \(2\) units per minute and end at \(2\) units per minute. Compare the total amount accumulated by machine a) and machine b). Which accumulates more, and by how much?
Figure for problem 551467

Hints

- Equal starting and ending rates do not determine what happens between those times. - Break each region under the rate graph into familiar geometric shapes. - Compare the two total areas rather than only the endpoint heights.

Solution

1. For machine a), the rate is constantly \(2\) units per minute, so the rectangular area is \(4\cdot 2=8\) units. 2. For machine b), view the region as the same \(4\)-by-\(2\) rectangle plus a triangle above it with base \(4\) minutes and height \(2\) units per minute. 3. Machine b) accumulates \(8+\frac{1}{2}\cdot 4\cdot 2=12\) units. 4. Therefore, machine b) accumulates \(12-8=4\) more units, even though the two machines have the same initial and final rates.

Answer

Machine a) accumulates \(8\) units. Machine b) accumulates \(12\) units. Machine b) accumulates \(4\) more units.
55146812
A simplified power-use model for a device is piecewise linear through the points shown on the graph: \((0,1)\), \((1,3)\), \((2,2)\), \((3,5)\), and \((4,3)\), where time is measured in hours and power in kilowatts. a) Use four \(1\)-hour trapezoids to find the energy used by this piecewise-linear model over \(4\) hours. b) Use a coarser two-interval estimate based only on the values at \(t=0,2,4\). c) Explain why the coarse estimate is smaller, and state the energy unit.
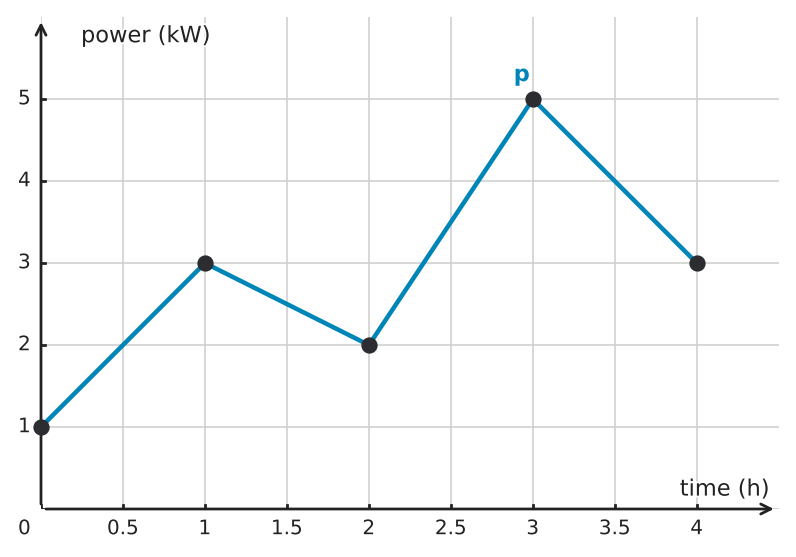
Figure for problem 551468

Hints

- For each trapezoid, average the two endpoint heights and multiply by the interval width. - Keep the four-interval and two-interval calculations separate. - Compare which visible peaks are represented by each partition. - Multiply the power unit by the time unit to determine the accumulated-energy unit.

Solution

a) The four trapezoid areas are \(\frac{1+3}{2}(1)=2\), \(\frac{3+2}{2}(1)=2.5\), \(\frac{2+5}{2}(1)=3.5\), and \(\frac{5+3}{2}(1)=4\). Their total is \(12\,\text{kWh}\). b) Using only \(t=0,2,4\), the two trapezoids have width \(2\) hours. The estimate is \(2\cdot\frac{1+2}{2}+2\cdot\frac{2+3}{2}=8\,\text{kWh}\). c) The coarse estimate skips the higher intermediate power values at \(t=1\) and \(t=3\), so its straight segments cut below substantial parts of the displayed model. Power in kilowatts multiplied by time in hours gives kilowatt-hours.

Answer

a) \(12\,\text{kWh}\) b) \(8\,\text{kWh}\) c) The coarse estimate misses the intermediate peaks, so it is smaller. The accumulated energy unit is kilowatt-hours.


All problems may be used, copied and printed free of charge for school and tutoring, including paid tutoring. Commercial adaptations as well as publication or redistribution on the internet are not permitted.
