Aimathic
Login | English | Deutsch

Free Math Worksheets

Build your own math worksheets from 21,000 problems for grades 3 to 12, from fractions to calculus. Every problem includes step-by-step solutions.

Box plots

Click problems to add them to your worksheet.

5387716
In the box plot, open circles represent outliers and the \(\times\) marks the mean. Name all displayed values outside the whiskers, and give the two whisker endpoints.
Figure for problem 538771

Hints

- Open circles and whisker endpoints use different symbols. - Read each position from the scale. - The \(\times\) is not one of the requested values.

Solution

1. The open circles outside the whiskers are at \(10\,\text{dB}\) and \(55\,\text{dB}\). 2. The left whisker endpoint is \(20\,\text{dB}\). 3. The right whisker endpoint is \(50\,\text{dB}\).

Answer

The values outside the whiskers are \(10\,\text{dB}\) and \(55\,\text{dB}\). The whisker endpoints are \(20\,\text{dB}\) and \(50\,\text{dB}\).
5350636
The box plot summarizes a pizza restaurant's delivery times during one month. a) Find the shortest delivery time. b) Find the median delivery time. c) Find the time that at least \(75\%\) of the deliveries did not exceed. d) Find the interquartile range (IQR).
Figure for problem 535063

Hints

- Identify the five values represented by the whiskers, box edges, and median line. - The third quartile is the value at or below which at least \(75\%\) of the data lie. - The IQR is the width of the box.

Solution

1. The left whisker endpoint shows a minimum of \(15\) minutes. 2. The line inside the box shows a median of \(30\) minutes. 3. The right edge of the box is \(Q_3 = 40\) minutes, so at least \(75\%\) of the delivery times are no more than \(40\) minutes. 4. The IQR is \(Q_3 - Q_1 = 40 - 20 = 20\) minutes.

Answer

a) \(15\) minutes b) \(30\) minutes c) \(40\) minutes d) \(20\) minutes
5350826
A battery manufacturer tested how long a new battery model lasted under continuous use. The sample results are summarized in the box plot. a) Between what two times did the middle \(50\%\) of the batteries last? b) Find the interquartile range. c) What minimum percent of the batteries lasted at least \(6\) hours?
Figure for problem 535082

Hints

- The two edges of the box are the first and third quartiles. - Subtract \(Q_1\) from \(Q_3\) to find the IQR. - Consider what percent of the data lies at or above the first quartile.

Solution

1. The box extends from \(Q_1 = 6\) hours to \(Q_3 = 11\) hours. Therefore, the middle \(50\%\) lasted from \(6\) to \(11\) hours. 2. The IQR is \(11 - 6 = 5\) hours. 3. Since \(6\) hours is the first quartile, at least \(75\%\) of the batteries lasted \(6\) hours or more.

Answer

a) From \(6\) hours to \(11\) hours b) \(5\) hours c) At least \(75\%\)
5350866
The box plots show the daily rainfall, in millimeters, in two cities during one month. Which city has the higher median daily rainfall? What is the difference between the medians?
Figure for problem 535086

Hints

- Which line inside each box represents the median? - Read both values carefully from the scale.

Solution

1. Read the median from the line inside each box: City X has a median of \(45\,\text{mm}\), and City Y has a median of \(55\,\text{mm}\). 2. City Y has the higher median. 3. The difference is \(55 - 45 = 10\,\text{mm}\).

Answer

City Y has the higher median daily rainfall. The medians differ by \(10\,\text{mm}\).
5350876
The box plots compare delivery times for two pizza restaurants. Find the range for each restaurant. Which restaurant delivers within the smaller overall time interval?
Figure for problem 535087

Hints

- The range is the maximum minus the minimum. - Read the minimum and maximum from the ends of each pair of whiskers.

Solution

1. Restaurant A has a minimum of \(15\) minutes and a maximum of \(60\) minutes, so its range is \(60 - 15 = 45\) minutes. 2. Restaurant B has a minimum of \(20\) minutes and a maximum of \(45\) minutes, so its range is \(45 - 20 = 25\) minutes. 3. Since \(25 < 45\), Restaurant B delivers within the smaller overall time interval.

Answer

Restaurant A has a range of \(45\) minutes. Restaurant B has a range of \(25\) minutes. Restaurant B delivers within the smaller overall time interval.
5387496
The box plot shows quiz results. The median line and an \(\times\) marking the mean are shown. a) Read the median. b) Is the mean above or below the median?
Figure for problem 538749

Hints

- Distinguish the line inside the box from the \(\times\). - Use the labeled scale. - Compare the two values.

Solution

1. The median line is at \(30\) points. 2. The \(\times\) marking the mean is at \(25\) points. 3. Since \(25 < 30\), the mean is below the median.

Answer

a) \(30\) points b) The mean is below the median.
5387576
The box plot shows times for an obstacle course. Open circles represent outliers, and the \(\times\) marks the mean. a) Read the left whisker endpoint, \(Q_1\), the median, \(Q_3\), and the right whisker endpoint. b) Give the outliers and the mean.
Figure for problem 538757

Hints

- Match each symbol in the box plot with its meaning. - Read values only from labeled tick marks. - Distinguish the whisker endpoints from the open circles.

Solution

1. The whisker endpoints are \(15\) seconds and \(55\) seconds. 2. The quartiles and median are \(Q_1 = 25\), median \(35\), and \(Q_3 = 45\) seconds. 3. The outliers are \(5\) seconds and \(100\) seconds. 4. The mean is \(40\) seconds.

Answer

a) \(15, 25, 35, 45, 55\) seconds b) Outliers: \(5\) seconds and \(100\) seconds; mean: \(40\) seconds
5387616
The box plot shows scores on a workshop quiz. Find the length of the box and explain which half of the results it contains.
Figure for problem 538761

Hints

- Read the values at the two edges of the box. - The whiskers are not part of the box length. - Recall what percent of the data lies between the quartiles.

Solution

1. The left edge of the box is \(Q_1 = 15\) points. 2. The right edge of the box is \(Q_3 = 40\) points. 3. The length of the box is \(40 - 15 = 25\) points. 4. The interval from \(Q_1\) to \(Q_3\) contains the middle \(50\%\) of the results.

Answer

The box is \(25\) points long and contains the middle \(50\%\) of the results.
5387626
A box plot represents exactly \(40\) measurements, with no repeated values at the quartile boundaries. About how many measurements are a) at or below \(Q_1\), b) between \(Q_1\) and the median, c) between the median and \(Q_3\), and d) at or above \(Q_3\)?

Hints

- A box plot divides ordered data into four approximately equal groups. - Find one-fourth of the total number of measurements. - The condition about repeated values avoids ambiguity at the boundaries.

Solution

1. The quartiles divide the ordered data into four groups, each containing about one-fourth of the measurements. 2. One-fourth of \(40\) is \(40 \div 4 = 10\). 3. Therefore, each of the four described regions contains about \(10\) measurements.

Answer

a) About \(10\) b) About \(10\) c) About \(10\) d) About \(10\)
5387726
Read the five-number summary from the vertical box plot, and find the range.
Figure for problem 538772

Hints

- Read the box plot from bottom to top. - The edges of the box are the quartiles. - Use the whisker endpoints for the range.

Solution

1. The five-number summary is minimum \(4\), \(Q_1 = 10\), median \(14\), \(Q_3 = 20\), and maximum \(26\) centimeters. 2. The range is \(26 - 4 = 22\) centimeters.

Answer

Minimum \(4\), \(Q_1 = 10\), median \(14\), \(Q_3 = 20\), maximum \(26\) centimeters; range \(22\) centimeters.
5387856
The box plot shows setup times. The \(\times\) marks the mean, and open circles mark outliers. Which measure better completes the statement “A typical group needs about ... minutes”: the mean or the median? Explain.
Figure for problem 538785

Hints

- Read the median, mean, and outliers separately. - Compare the measures with the interval containing the box and whiskers. - Focus on what “typical” means in this context.

Solution

1. The median is \(8\) minutes, and the mean is \(10\) minutes. 2. Most displayed values lie between \(4\) and \(12\) minutes. 3. The high outliers at \(30\) and \(36\) minutes pull the mean upward. 4. Therefore, the median better describes a typical group.

Answer

The median of \(8\) minutes is more representative because the high outliers pull the mean up to \(10\) minutes.
5387866
The box plot is approximately symmetric. The mean and median are both \(30\) points, and no outliers are shown. Decide whether the mean is an appropriate summary of the distribution.
Figure for problem 538786

Hints

- Compare the two measures of center. - Examine the symmetry of the box and whiskers. - Look for unusual individual values.

Solution

1. The mean and median are equal. 2. The distances to the left and right of the median are equal. 3. No outliers are shown that would strongly shift the mean. 4. Therefore, the mean is an appropriate summary of the center.

Answer

Yes. The mean of \(30\) points is appropriate because the distribution is symmetric and has no displayed outliers.
5100556
Which number must be added to the data set \(0.5, 0.7, 3.3, 3.6, 4.8, 5.2, 6.0\) so that it matches the box plot? a) \(4.0\) b) \(4.4\) c) \(4.6\) d) \(5.0\)
Figure for problem 510055

Hints

- Read the five-number summary from the box plot. - Use the line inside the box to identify the required median. - After adding a number, reorder the data and check the quartiles.

Solution

1. The box plot shows a minimum of \(0.5\), a first quartile of \(2.0\), a median of \(4.0\), a third quartile of \(5.0\), and a maximum of \(6.0\). 2. Adding \(4.4\) gives the ordered data set \(0.5, 0.7, 3.3, 3.6, 4.4, 4.8, 5.2, 6.0\). The two middle values are \(3.6\) and \(4.4\), so the median is \((3.6 + 4.4) \div 2 = 4.0\). 3. The lower half is \(0.5, 0.7, 3.3, 3.6\), so \(Q_1 = (0.7 + 3.3) \div 2 = 2.0\). 4. The upper half is \(4.4, 4.8, 5.2, 6.0\), so \(Q_3 = (4.8 + 5.2) \div 2 = 5.0\).

Answer

b) \(4.4\)
5316496
Two battery brands, A and B, were tested under continuous use. The box plots show the battery-life results in hours. a) Find the median and range for each brand. b) A buyer needs batteries that will reliably last at least \(30\) hours. Based on the test data, which brand should the buyer choose? Explain using the box plots.
Figure for problem 531649

Hints

- Read each median from the line inside the box. - Find each range using the two whisker endpoints. - Compare the minimum tested life with the required \(30\) hours.

Solution

1. Brand A has a median of \(40\) hours and a range of \(60 - 20 = 40\) hours. 2. Brand B has a median of \(39\) hours and a range of \(45 - 32 = 13\) hours. 3. Brand A has a tested minimum of \(20\) hours, so some tested batteries lasted less than \(30\) hours. 4. Brand B has a tested minimum of \(32\) hours, so every tested battery lasted at least \(30\) hours. Based on this sample, Brand B better meets the requirement.

Answer

a) Brand A: median \(40\) hours, range \(40\) hours Brand B: median \(39\) hours, range \(13\) hours b) Brand B, because every tested Brand B battery lasted at least \(32\) hours.
5316506
A transit agency studied delays on bus routes 101 and 102. The box plots show the recorded delays in minutes. a) Read \(Q_3\) and the maximum delay for each route. b) Which route has the smaller median? What does this mean for riders in everyday travel? c) Why might a rider who must catch an important train still choose Route 102? Justify your answer using the box plots.
Figure for problem 531650

Hints

- Read \(Q_3\) from the right edge of each box. - Read the maximum from the right whisker endpoint. - Interpret the median as the middle recorded delay. - Compare the largest observed delays for the connection decision.

Solution

1. Route 101 has \(Q_3 = 7\) minutes and a maximum recorded delay of \(15\) minutes. Route 102 has \(Q_3 = 6\) minutes and a maximum recorded delay of \(8\) minutes. 2. Route 101 has the smaller median: \(4\) minutes compared with \(5\) minutes for Route 102. At least half of the recorded Route 101 trips were delayed by no more than \(4\) minutes. 3. Route 102 had a much smaller maximum recorded delay, \(8\) minutes instead of \(15\). For a time-sensitive connection, that smaller observed worst delay may make Route 102 preferable, although the sample does not guarantee future delays.

Answer

a) Route 101: \(Q_3 = 7\) minutes, maximum \(15\) minutes Route 102: \(Q_3 = 6\) minutes, maximum \(8\) minutes b) Route 101 has the smaller median, \(4\) minutes. c) Route 102 had the smaller maximum recorded delay, which may reduce the risk of missing a connection.
5316546
A class of \(24\) students was surveyed about their weekly allowances. The results are shown in the box plot. a) Find the minimum, first quartile, median, third quartile, and maximum. b) Find the range and the interquartile range (IQR). c) What minimum percent of the students receive at least \(\$25\) per week? What is the minimum number of students?
Figure for problem 531654

Hints

- Identify the five values represented by the endpoints, box edges, and median line. - The range uses the maximum and minimum; the IQR uses the two quartiles. - Think about what fraction of the data lies at or above \(Q_1\). - Convert that percent to a number of students out of \(24\).

Solution

1. The box plot shows a minimum of \(\$15\), \(Q_1 = \$25\), a median of \(\$35\), \(Q_3 = \$45\), and a maximum of \(\$65\). 2. The range is \(\$65 - \$15 = \$50\). 3. The IQR is \(\$45 - \$25 = \$20\). 4. Since \(Q_1 = \$25\), at least \(75\%\) of the students receive \(\$25\) or more. The minimum number is \(0.75 \times 24 = 18\) students.

Answer

a) Minimum: \(\$15\); first quartile: \(\$25\); median: \(\$35\); third quartile: \(\$45\); maximum: \(\$65\) b) Range: \(\$50\); IQR: \(\$20\) c) At least \(75\%\), or at least \(18\) students
5316736
Two classes ran a \(100\)-meter sprint. Their times are shown in the box plots. a) Find the range of times for each class. b) Which class has an interquartile range of exactly \(5\) seconds? c) Which class has the faster median time? Give the median. d) Is this statement true or false? Explain: “At least \(75\%\) of Class A ran in \(18\) seconds or less.”
Figure for problem 531673

Hints

- Identify the five values shown by each box plot. - The IQR is the length of the box. - For race times, a smaller median is faster. - Recall what percent of the data lies at or below \(Q_3\).

Solution

1. Class A has range \(21 - 13 = 8\) seconds. Class B has range \(20 - 12 = 8\) seconds. 2. Class A has IQR \(18 - 15 = 3\) seconds. Class B has IQR \(19 - 14 = 5\) seconds, so Class B has the requested IQR. 3. The median times are \(16\) seconds for Class A and \(17\) seconds for Class B. A lower sprint time is faster, so Class A has the faster median. 4. Class A has \(Q_3 = 18\) seconds. At least \(75\%\) of its recorded times are at or below \(18\) seconds, so the statement is true.

Answer

a) Class A: \(8\) seconds; Class B: \(8\) seconds b) Class B c) Class A, with a median of \(16\) seconds d) True, because \(Q_3 = 18\) seconds for Class A.
5350566
An electronics store compares the lifetimes of two types of LED bulbs. Sample results, measured in hours, are shown in the box plots. a) State the lower quartile \(Q_1\) and upper quartile \(Q_3\) for Type B. b) The store will carry only a bulb type for which at least \(75\%\) of the bulbs are guaranteed by the sample to last at least \(8000\,\text{h}\). Which type clearly meets this criterion? Explain. c) Compare the maximum lifetimes. Which type produced the longest-lasting individual bulb in the test?
Figure for problem 535056

Hints

- Read the values at the left and right edges of Type B's box. - Which quartile separates the lowest \(25\%\) from the highest \(75\%\)? - The maximum is at the far end of the right whisker.

Solution

1. For Type B, the left edge of the box is \(Q_1 = 8500\,\text{h}\), and the right edge is \(Q_3 = 10{,}000\,\text{h}\). 2. For Type B, \(Q_1 = 8500\,\text{h}\). Therefore, at least \(75\%\) of its bulbs lasted \(8500\,\text{h}\) or more, so Type B clearly meets the \(8000\,\text{h}\) criterion. 3. For Type A, \(Q_1 = 7500\,\text{h}\) and the median is \(8500\,\text{h}\). The box plot does not show whether at least \(75\%\) of the bulbs lasted at least \(8000\,\text{h}\), so Type A is not guaranteed to meet the criterion. 4. The maximum for Type A is \(11{,}500\,\text{h}\), compared with \(10{,}500\,\text{h}\) for Type B. Type A produced the longest-lasting individual bulb.

Answer

a) \(Q_1 = 8500\,\text{h}\); \(Q_3 = 10{,}000\,\text{h}\) b) Type B clearly meets the criterion. The box plot does not guarantee that Type A does. c) Type A, with a maximum of \(11{,}500\,\text{h}\), compared with \(10{,}500\,\text{h}\) for Type B.
5350626
Two classes participated in a math competition worth up to \(40\) points. Their results are shown in the box plots. a) Which class has the higher median score? b) Which class has the greater range? c) In which class are the middle \(50\%\) of the scores closer together? Justify your answer using the interquartile range (IQR).
Figure for problem 535062

Hints

- The median is the line inside each box. - The range is the maximum minus the minimum. - The box represents the middle \(50\%\) of the data. - The IQR is \(Q_3 - Q_1\).

Solution

1. The median for Class A is \(24\) points, and the median for Class B is \(26\) points. Class B has the higher median. 2. Class A's range is \(40 - 12 = 28\) points. Class B's range is \(36 - 14 = 22\) points. Class A has the greater range. 3. Class A's IQR is \(30 - 18 = 12\) points. Class B's IQR is \(28 - 22 = 6\) points. Because Class B has the smaller IQR, its middle \(50\%\) of scores are closer together.

Answer

a) Class B, with a median of \(26\) points b) Class A, with a range of \(28\) points c) Class B. Its IQR is \(6\) points, compared with \(12\) points for Class A.
5350646
Felix and Lara used an app to count their daily steps for \(10\) days. Their results are shown in the table. <table> <tr><th>Day</th><td>\(1\)</td><td>\(2\)</td><td>\(3\)</td><td>\(4\)</td><td>\(5\)</td><td>\(6\)</td><td>\(7\)</td><td>\(8\)</td><td>\(9\)</td><td>\(10\)</td></tr> <tr><th>Felix</th><td>\(6250\)</td><td>\(7500\)</td><td>\(8000\)</td><td>\(8500\)</td><td>\(8750\)</td><td>\(9250\)</td><td>\(10{,}500\)</td><td>\(11{,}000\)</td><td>\(12{,}500\)</td><td>\(14{,}000\)</td></tr> <tr><th>Lara</th><td>\(8000\)</td><td>\(8250\)</td><td>\(8500\)</td><td>\(8750\)</td><td>\(9000\)</td><td>\(9500\)</td><td>\(9750\)</td><td>\(10{,}250\)</td><td>\(10{,}500\)</td><td>\(11{,}000\)</td></tr> </table> The box plots use the median-of-halves method: \(Q_1\) and \(Q_3\) are the medians of the lower and upper five values. a) Find the median and range of each person's daily step counts. b) Use the box plots to compare the data. Who is more active according to the median? c) Whose daily step counts vary less? Justify your answer using the box plots.
Figure for problem 535064

Hints

- For \(10\) values, average positions \(5\) and \(6\) to find the median. - The range is the maximum minus the minimum. - Compare both the total lengths and the box lengths of the box plots. - The line inside the box marks the median.

Solution

1. Felix's median is the mean of the fifth and sixth values: \((8750 + 9250) \div 2 = 9000\) steps. His range is \(14{,}000 - 6250 = 7750\) steps. 2. Lara's median is \((9000 + 9500) \div 2 = 9250\) steps. Her range is \(11{,}000 - 8000 = 3000\) steps. 3. Lara is more active according to the median because \(9250 > 9000\). 4. Lara's counts vary less. Her range is smaller, and her box is shorter: her IQR is \(10{,}250 - 8500 = 1750\) steps, compared with Felix's IQR of \(11{,}000 - 8000 = 3000\) steps.

Answer

a) Felix: median \(9000\) steps, range \(7750\) steps; Lara: median \(9250\) steps, range \(3000\) steps b) Lara is more active according to the median. c) Lara's daily step counts vary less because both her range and her IQR are smaller.
5350666
The box plots compare the battery life, in hours, of two laptop models tested under the same conditions. a) Which model has the higher median battery life? State the value. b) Which model has more consistent battery life? Explain briefly. c) What minimum percentage of Model X laptops lasted at least \(10\) hours? d) What is the range for Model Y?
Figure for problem 535066

Hints

- The median is the line inside each box. - Shorter boxes and whiskers indicate less variability. - Recall what percentage of the data lies at or above \(Q_3\). - Find the range by subtracting the minimum from the maximum.

Solution

1. Both Model X and Model Y have a median of \(8\,\text{h}\), so neither has a higher median. 2. Model Y is more consistent. Its range is \(9 - 7 = 2\,\text{h}\), compared with \(12 - 4 = 8\,\text{h}\) for Model X. Its IQR is also smaller: \(8.5 - 7.5 = 1\,\text{h}\), compared with \(10 - 6 = 4\,\text{h}\) for Model X. 3. For Model X, \(Q_3 = 10\,\text{h}\). At least the highest \(25\%\) of the values are therefore \(10\,\text{h}\) or greater. 4. Model Y's range is \(9 - 7 = 2\,\text{h}\).

Answer

a) Neither; both medians are \(8\,\text{h}\). b) Model Y, because its range and IQR are smaller. c) At least \(25\%\) d) \(2\,\text{h}\)
5350696
Students in two classes recorded how many pages they read during the same reading period. The results are summarized in the box plots. Which statements are true? 1. At least one student in Class B read more pages than every student in Class A. 2. The median number of pages is higher in Class A than in Class B. 3. In Class B, about \(50\%\) of the values are between \(23\) and \(27.5\) pages. 4. The range for Class A is smaller than the range for Class B.
Figure for problem 535069

Hints

- Compare the endpoints of the whiskers for the extrema and ranges. - The line inside each box marks the median. - The box contains the middle \(50\%\) of the data. - The range is the maximum minus the minimum.

Solution

1. Statement 1 is true. Class B's maximum is \(35\), while Class A's maximum is \(32\). 2. Statement 2 is false. Class A's median is \(23.5\), and Class B's median is \(25.5\). 3. Statement 3 is true. Class B's box extends from \(Q_1 = 23\) to \(Q_3 = 27.5\), and the box represents the middle \(50\%\) of the data. 4. Statement 4 is true. Class A's range is \(32 - 15 = 17\), while Class B's range is \(35 - 10 = 25\).

Answer

Statements \(1\), \(3\), and \(4\) are true.
5350756
Two training groups recorded their times for a \(5\text{K}\) race. The results are summarized in the box plots. a) Which group has the fastest runner in the entire study? b) Which group has more consistent times? Justify your answer using the range. c) In which group or groups did at least \(50\%\) of the runners finish in \(26\) minutes or less?
Figure for problem 535075

Hints

- For race times, the smallest value represents the fastest runner. - The range is the maximum minus the minimum. - The median divides the ordered data into two halves.

Solution

1. The fastest runner has the minimum time. Group A's minimum is \(20\) minutes, and Group B's minimum is \(23\) minutes, so Group A has the fastest runner. 2. Group A's range is \(32 - 20 = 12\) minutes. Group B's range is \(29 - 23 = 6\) minutes. Group B has more consistent times because its range is smaller. 3. Group A's median is \(25\) minutes, so at least \(50\%\) of its runners finished in \(25\) minutes or less. Group B's median is \(26\) minutes, so at least \(50\%\) finished in \(26\) minutes or less. The condition holds for both groups.

Answer

a) Group A, with a minimum time of \(20\) minutes b) Group B, because its range is \(6\) minutes rather than \(12\) minutes c) Both groups
5350776
The vertical box plots compare how many books students in two classes read last year. a) Give the first quartile, \(Q_1\), and third quartile, \(Q_3\), for Class A. b) What is the least and greatest number of books read by the middle \(50\%\) of Class B? c) Which class has the greater range? Find the difference between the two ranges.
Figure for problem 535077

Hints

- The lower and upper edges of a box represent \(Q_1\) and \(Q_3\). - The box contains the middle \(50\%\) of the data. - Find each range by subtracting the minimum from the maximum.

Solution

1. For Class A, the lower and upper edges of the box show \(Q_1 = 2\) and \(Q_3 = 8\). 2. For Class B, the box extends from \(4\) to \(7\). Therefore, the middle \(50\%\) read from \(4\) to \(7\) books. 3. Class A has range \(20 - 0 = 20\) books. Class B has range \(12 - 1 = 11\) books. 4. Class A has the greater range, and the difference is \(20 - 11 = 9\) books.

Answer

a) \(Q_1 = 2\) and \(Q_3 = 8\) b) At least \(4\) books and at most \(7\) books c) Class A; the difference between the ranges is \(9\) books.
5350846
Two groups of students measured their daily smartphone use, in minutes. Group 1: \(40, 60, 100, 140, 240\) Group 2: \(80, 100, 120, 140, 160\) To find the quartiles, do not include the overall median in either half of the data. The data are shown in the box plots. Find the interquartile range (the length of the box) for each group. Which group has less variability in the middle \(50\%\) of the data?
Figure for problem 535084

Hints

- The length of the box represents the IQR. - Find the IQR using \(Q_3 - Q_1\). - A smaller IQR means less variability in the middle half of the data.

Solution

1. For Group 1, the lower half is \(40, 60\), so \(Q_1 = (40 + 60) \div 2 = 50\). The upper half is \(140, 240\), so \(Q_3 = (140 + 240) \div 2 = 190\). 2. For Group 2, the lower half is \(80, 100\), so \(Q_1 = (80 + 100) \div 2 = 90\). The upper half is \(140, 160\), so \(Q_3 = (140 + 160) \div 2 = 150\). 3. Group 1's IQR is \(190 - 50 = 140\) minutes. Group 2's IQR is \(150 - 90 = 60\) minutes. 4. Group 2 has less variability in the middle \(50\%\) because its IQR is smaller.

Answer

Group 1: \(140\) minutes; Group 2: \(60\) minutes. Group 2 has less variability in the middle \(50\%\) of the data.
5350886
Two basketball teams, Alpha and Beta, recorded their points per game over a season. The distributions are shown in the box plots. Based on the lower-scoring quarter of each team's games, which team appears stronger? Support your conclusion with values from the box plots.
Figure for problem 535088

Hints

- The lower whisker and the left edge of the box describe the lowest quarter of the data. - Compare the teams' minima and first quartiles. - Higher point totals indicate stronger scoring performance.

Solution

1. Team Alpha's lowest \(25\%\) of scores extend from \(40\) points to \(Q_1 = 50\) points. 2. Team Beta's lowest \(25\%\) extend from \(50\) points to \(Q_1 = 65\) points. 3. Team Beta's minimum of \(50\) points equals Team Alpha's first quartile, and Team Beta's first quartile of \(65\) points is greater than Team Alpha's median of \(60\) points. 4. Team Beta appears stronger based on its lower-scoring games because even its lower quarter is shifted toward higher scores.

Answer

Team Beta appears stronger. Its minimum is \(50\) points, equal to Team Alpha's \(Q_1\), and its \(Q_1\) of \(65\) points is greater than Team Alpha's median of \(60\) points.
5350906
Three delivery services were tested to see how many hours they took to deliver a standard package. The results are shown in the box plots. a) Which service is the most consistent if a customer wants the least variation in delivery time? Justify your answer using the range. b) Compare the medians. Which service or services deliver fastest according to the median? c) For Services A and B, state the intervals containing the middle \(50\%\) of delivery times.
Figure for problem 535090

Hints

- Compare the full lengths from minimum to maximum. - The line inside each box marks the median. - The interval from \(Q_1\) to \(Q_3\) contains the middle \(50\%\) of the data.

Solution

1. Service A's range is \(48 - 12 = 36\) hours. Service B's range is \(30 - 18 = 12\) hours. Service C's range is \(60 - 24 = 36\) hours. Service B is the most consistent because it has the smallest range. 2. Services A and B each have a median of \(24\) hours. Service C has a median of \(36\) hours. Services A and B are fastest according to the median. 3. The middle \(50\%\) of Service A's times are from \(20\) to \(28\) hours. The middle \(50\%\) of Service B's times are from \(22\) to \(26\) hours.

Answer

a) Service B, with a range of \(12\) hours b) Services A and B, each with a median of \(24\) hours c) Service A: \(20\) to \(28\) hours; Service B: \(22\) to \(26\) hours
5350916
A produce seller compares apple weights from two orchards, North and South. Samples from each orchard are shown in the box plots. a) What are the weights of the lightest and heaviest apples in the South sample? b) Find the interquartile range for each orchard. c) For which orchard do the middle \(50\%\) of the sample weights vary less? d) For which orchard can you conclude from the box plot that at least \(25\%\) of the apples weigh \(180\,\text{g}\) or more?
Figure for problem 535091

Hints

- The whisker endpoints show the minimum and maximum. - The IQR is the width of the box, \(Q_3 - Q_1\). - At least \(25\%\) of the values are at or above \(Q_3\).

Solution

1. For the South sample, the minimum is \(130\,\text{g}\), and the maximum is \(210\,\text{g}\). 2. The North orchard's IQR is \(175 - 145 = 30\,\text{g}\). The South orchard's IQR is \(180 - 150 = 30\,\text{g}\). 3. The middle \(50\%\) vary equally in the two samples because the IQRs are equal. 4. For the South orchard, \(Q_3 = 180\,\text{g}\), so at least \(25\%\) of the sample values are \(180\,\text{g}\) or more. The North orchard has \(Q_3 = 175\,\text{g}\), so the same conclusion cannot be guaranteed there.

Answer

a) Lightest: \(130\,\text{g}\); heaviest: \(210\,\text{g}\) b) Both IQRs are \(30\,\text{g}\). c) Neither; the middle \(50\%\) vary equally. d) The South orchard
5350936
A reaction-time test, measured in milliseconds, was given to two groups: regular video game players and people who rarely play. The sample results are shown in the box plots. a) Compare the medians. What do they indicate about typical reaction time in these samples? b) Which group has the greater range between its fastest and slowest participants? c) In which group are the middle \(50\%\) of the values closer together?
Figure for problem 535093

Hints

- The median is the line inside each box. - For reaction time, a smaller value means a faster response. - The range is the maximum minus the minimum. - Compare the box widths to compare the middle \(50\%\).

Solution

1. The regular players have a median of \(215\,\text{ms}\), and the infrequent players have a median of \(260\,\text{ms}\). Because a lower reaction time is faster, the regular players reacted faster typically in these samples. 2. The regular players' range is \(280 - 180 = 100\,\text{ms}\). The infrequent players' range is \(380 - 210 = 170\,\text{ms}\). The infrequent players have the greater range. 3. The regular players' IQR is \(230 - 200 = 30\,\text{ms}\). The infrequent players' IQR is \(290 - 240 = 50\,\text{ms}\). The middle \(50\%\) are closer together for the regular players.

Answer

a) Regular players: \(215\,\text{ms}\); infrequent players: \(260\,\text{ms}\). The regular-player sample has the faster typical reaction time. b) The infrequent-player group, with a range of \(170\,\text{ms}\) c) The regular-player group, with an IQR of \(30\,\text{ms}\)
5350946
A biology experiment compared the heights of sunflowers after four weeks using two fertilizers. a) Read the five-number summary for Fertilizer A: minimum, lower quartile, median, upper quartile, and maximum. b) A manufacturer claims that Fertilizer B produces more consistent growth than Fertilizer A. Do the box plots support the claim? Use the interquartile range (IQR) to justify your answer.
Figure for problem 535094

Hints

- Identify the whisker endpoints, box edges, and line inside the box. - Find each IQR using \(Q_3 - Q_1\). - A smaller IQR indicates more consistent values in the middle half of the data.

Solution

1. For Fertilizer A, the minimum is \(15\,\text{cm}\), \(Q_1 = 22\,\text{cm}\), the median is \(28\,\text{cm}\), \(Q_3 = 35\,\text{cm}\), and the maximum is \(45\,\text{cm}\). 2. Fertilizer A's IQR is \(35 - 22 = 13\,\text{cm}\). 3. Fertilizer B has \(Q_1 = 25\,\text{cm}\) and \(Q_3 = 33\,\text{cm}\), so its IQR is \(33 - 25 = 8\,\text{cm}\). 4. The box plots support the claim for the middle \(50\%\) of the data because Fertilizer B has the smaller IQR. Its total range is also smaller: \(38 - 20 = 18\,\text{cm}\), compared with \(45 - 15 = 30\,\text{cm}\) for Fertilizer A.

Answer

a) Minimum \(15\,\text{cm}\), \(Q_1 = 22\,\text{cm}\), median \(28\,\text{cm}\), \(Q_3 = 35\,\text{cm}\), maximum \(45\,\text{cm}\) b) Yes. Fertilizer B has an IQR of \(8\,\text{cm}\), compared with \(13\,\text{cm}\) for Fertilizer A.
5350966
Two classes took a math quiz worth \(50\) points. The box plots show the score distributions. a) Give the first quartile, \(Q_1\), and third quartile, \(Q_3\), for each class. b) For which class can you conclude that at least three-fourths of the students scored \(30\) points or more? Explain.
Figure for problem 535096

Hints

- The two edges of each box represent \(Q_1\) and \(Q_3\). - Think about what percent of the data lies at or above \(Q_1\).

Solution

1. For Class C, \(Q_1 = 20\) and \(Q_3 = 40\). 2. For Class D, \(Q_1 = 30\) and \(Q_3 = 42\). 3. At least \(75\%\) of the values are at or above the first quartile. 4. Since Class D has \(Q_1 = 30\), at least \(75\%\) of its students scored \(30\) points or more. Class C has \(Q_1 = 20\), so the box plot does not guarantee that result for Class C.

Answer

a) Class C: \(Q_1 = 20\), \(Q_3 = 40\) Class D: \(Q_1 = 30\), \(Q_3 = 42\) b) Class D, because its first quartile is \(30\) points.
5350996
Two teams competed in a math contest. Their members' scores are listed below. Team Blue: \(12, 15, 18, 20, 22, 25, 28, 30, 35\) Team Red: \(12, 22, 23, 24, 25, 26, 27, 28, 35\) Which box plot, (1) or (2), represents each team? Justify your answer by comparing the minimum, first quartile, median, third quartile, and maximum.
Figure for problem 535099

Hints

- Find the five-number summary for each ordered data set. - For nine values, exclude the median before finding the quartiles. - Compare the median and box edges with each box plot.

Solution

1. Team Blue has minimum \(12\), \(Q_1 = (15 + 18) \div 2 = 16.5\), median \(22\), \(Q_3 = (28 + 30) \div 2 = 29\), and maximum \(35\). 2. Team Red has minimum \(12\), \(Q_1 = (22 + 23) \div 2 = 22.5\), median \(25\), \(Q_3 = (27 + 28) \div 2 = 27.5\), and maximum \(35\). 3. Box plot (1) has median \(22\) and quartiles \(16.5\) and \(29\), so it represents Team Blue. 4. Box plot (2) has median \(25\) and quartiles \(22.5\) and \(27.5\), so it represents Team Red.

Answer

Box plot (1) represents Team Blue. Box plot (2) represents Team Red.
5387586
A box plot summarizes the number of pages read for a project. The right whisker ends at \(80\), and an outlier is shown at \(100\). Find a) the range between the whisker endpoints and b) the range of all displayed values.
Figure for problem 538758

Hints

- Decide which endpoints belong in each calculation. - An outlier can lie beyond a whisker. - Do not confuse the width of the box with the range.

Solution

1. The range between the whisker endpoints is \(80 - 20 = 60\) pages. 2. For all displayed values, the outlier at \(100\) is the maximum. 3. The range of all displayed values is \(100 - 20 = 80\) pages.

Answer

a) \(60\) pages b) \(80\) pages
5387646
In the box plot, the \(\times\) marking the mean is to the right of the median. An open circle marks an outlier. Is the position of the mean a drawing error? Justify your answer using the displayed values.
Figure for problem 538764

Hints

- Compare the \(\times\) with the open circle. - The box and whiskers do not include every displayed value. - Consider how one very large value affects a mean.

Solution

1. The median is \(\$40\), and the mean is \(\$45\). 2. A high outlier is shown at \(\$120\). 3. This unusually large value pulls the mean to the right of the median. 4. Therefore, the positions are possible and are not a drawing error.

Answer

No. The outlier at \(\$120\) pulls the mean to \(\$45\), which is to the right of the median at \(\$40\).
5387686
Which statements about the box plot are true? 1. The box is \(40\) points long. 2. The range of all displayed values is \(80\) points. 3. The median is greater than the mean. 4. The open circle at \(5\) is the left whisker endpoint.
Figure for problem 538768

Hints

- Check each statement separately. - Distinguish the whisker endpoints from all displayed values. - Distinguish the \(\times\) marking the mean from the median line.

Solution

1. The box length is \(70 - 30 = 40\), so statement 1 is true. 2. All displayed values extend from the outlier at \(5\) to \(90\), so the range is \(90 - 5 = 85\). Statement 2 is false. 3. The median is \(50\), and the mean is \(45\), so statement 3 is true. 4. The open circle at \(5\) is an outlier, not a whisker endpoint. Statement 4 is false.

Answer

Statements 1 and 3 are true.
5387876
The box plot shows scores. The mean is \(17.5\) points, and the median is \(20\) points. Explain why the mean is smaller, and decide which measure better describes a usual score.
Figure for problem 538787

Hints

- Look for values on the side toward which the mean is shifted. - Compare the median with the interval represented by the box. - A measure of a usual value should not be controlled by a few extremes.

Solution

1. Two low outliers are shown at \(2.5\) and \(5\) points. 2. These low values pull the mean downward. 3. The middle \(50\%\) of the scores lie from \(15\) to \(25\) points. 4. The median of \(20\) points better describes a usual score.

Answer

The low outliers pull the mean downward. The median of \(20\) points better describes a usual score.
5388076
Three statements are made about the box plot: A: “Most processing times are around \(14\) minutes.” B: “A typical processing time is closer to \(10\) minutes.” C: “The outliers have no effect on the mean.” Which statement is best supported?
Figure for problem 538807

Hints

- Compare each statement with the box, median, mean, and outliers. - The mean does not always show where most values lie. - Choose the statement that accounts for the entire displayed distribution.

Solution

1. The median is \(10\) minutes, and the box extends from \(8\) to \(12\) minutes. 2. The high outliers at \(30\) and \(40\) minutes pull the mean to \(14\) minutes. 3. Statement A mistakes the shifted mean for the location of most values. 4. Statement C is false because the outliers increase the mean. 5. Statement B agrees with the box and the median.

Answer

Statement B is best supported. The median of \(10\) minutes is at the center of the box, while high outliers raise the mean.
5388086
Two art studios recorded how long students took to complete the same printmaking technique. a) Compare the typical times using the medians. b) Compare the variability using the lengths of the boxes. c) Explain why Studio North has a greater mean even though it has the smaller median.
Figure for problem 538808

Hints

- Read the median, box edges, mean markers, and outlier separately. - Use the specific measure requested in each part. - Consider how one unusually large value affects the mean.

Solution

1. Studio North has a median of \(4\) minutes, and Studio South has a median of \(5\) minutes. Studio North is typically faster according to the median. 2. Studio North's box has length \(6 - 3 = 3\) minutes. Studio South's box also has length \(6 - 3 = 3\) minutes. Their middle \(50\%\) have equal variability according to the IQR. 3. Studio North has a high outlier at \(14\) minutes. This value raises North's mean to \(5\) minutes, which is greater than South's mean of \(4.5\) minutes.

Answer

a) Studio North is typically faster: median \(4\) minutes versus \(5\) minutes for Studio South. b) Both IQRs are \(3\) minutes. c) North's \(14\)-minute outlier raises its mean to \(5\) minutes, above South's mean of \(4.5\) minutes.
5316696
After three weeks, seven students measured the heights of their sunflower seedlings. The recorded heights were \(3, 5, 9, 10, 12, 19, 21\) centimeters. Jordan was absent, but the teacher had already drawn the box plot for all eight measurements. How tall was Jordan's sunflower seedling? Justify your answer using the values shown in the box plot.
Figure for problem 531669

Hints

- Read the five-number summary from the box plot. - Determine where the median and quartiles occur in an ordered list of eight values. - Place the known measurements in order and identify where the missing value must lie. - Use the third quartile to write an equation for the missing value.

Solution

1. The box plot shows a minimum of \(3\), \(Q_1 = 7\), a median of \(11\), \(Q_3 = 17\), and a maximum of \(21\). 2. With eight ordered values, the median is the mean of the fourth and fifth values. The known values \(10\) and \(12\) must remain in those positions because \((10 + 12) \div 2 = 11\). Thus, the missing value lies between \(12\) and \(19\). 3. The upper half is then \(12, x, 19, 21\), so \(Q_3 = (x + 19) \div 2\). 4. Set \((x + 19) \div 2 = 17\). Then \(x + 19 = 34\), so \(x = 15\). 5. This value fits between \(12\) and \(19\), and the complete data set has the five-number summary shown.

Answer

Jordan's sunflower seedling was \(15\,\text{cm}\) tall.
5316746
Which unordered data set matches the box plot? (1) \(11, 9, 4, 13, 15, 9, 18, 6, 8, 2, 3, 16\) (2) \(10, 12, 4, 15, 16, 12, 8, 13, 6, 3, 18, 2\) (3) \(13, 16, 9, 6, 18, 4, 9, 2, 8, 15, 11, 8\) Justify your choice by finding each data set's minimum, first quartile, median, third quartile, and maximum and comparing them with the box plot.
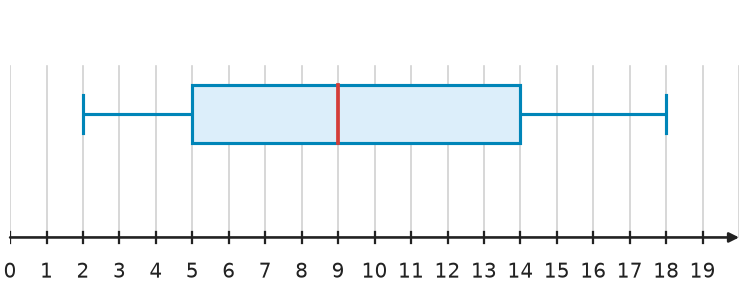
Figure for problem 531674

Hints

- Read the five-number summary from the box plot first. - Order each data set before finding its median and quartiles. - Check whether the minimum and maximum eliminate any choices. - Compare the remaining quartiles and median one at a time.

Solution

1. The box plot shows the five-number summary \(2, 5, 9, 14, 18\). 2. Data set (1), in order, is \(2, 3, 4, 6, 8, 9, 9, 11, 13, 15, 16, 18\). Its minimum is \(2\), \(Q_1 = (4 + 6) \div 2 = 5\), median is \((9 + 9) \div 2 = 9\), \(Q_3 = (13 + 15) \div 2 = 14\), and maximum is \(18\). These values match the box plot. 3. Data set (2) has median \((10 + 12) \div 2 = 11\), so it does not match. 4. Data set (3) has \(Q_1 = (6 + 8) \div 2 = 7\), so it does not match. 5. Therefore, only data set (1) matches the box plot.

Answer

Data set (1) matches the box plot. Its five-number summary is \(2, 5, 9, 14, 18\).

All problems may be used, copied and printed free of charge for school and tutoring, including paid tutoring. Commercial adaptations as well as publication or redistribution on the internet are not permitted.

