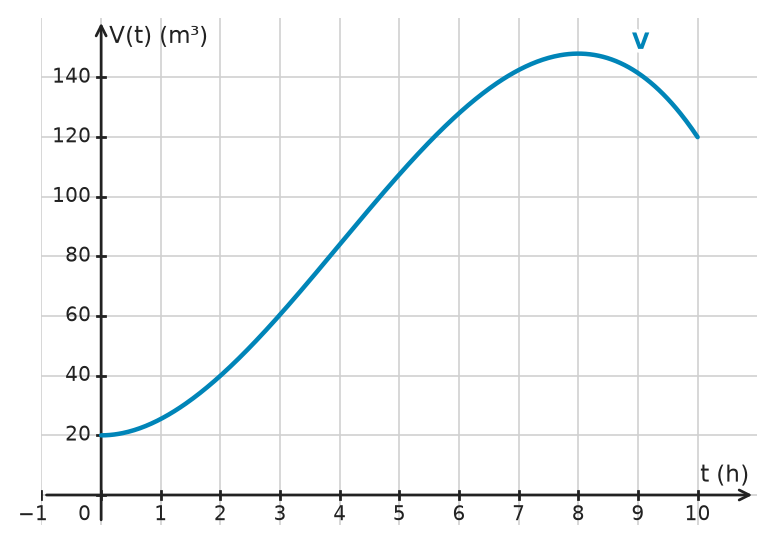
The graph shows the water volume \(V(t)\), in cubic meters, in a stormwater retention basin over \(0\le t\le10\) hours. The model is \(V(t)=-0.5t^3+6t^2+20\).
a) Calculate the inflection point of \(V\) on \([0, 10]\). Explain how it appears on the graph and what it means for the changing water volume.
b) Find the maximum rate of change of the water volume during the 10-hour period.
c) Describe the graph’s concavity before and after the inflection point, and interpret it in context.
Hints
- Which derivatives locate and verify an inflection point?
- What quantity represents the instantaneous rate of change of volume?
- Where does the slope reach a maximum when concavity changes from up to down?
- Interpret the signs of the first and second derivatives separately.
Solution
1. Differentiate: \(V'(t)=-1.5t^2+12t\), \(V''(t)=-3t+12\), and \(V'''(t)=-3\).
2. Solve \(V''(t)=0\): \(-3t+12=0\), so \(t=4\). Since \(V'''(4)=-3\ne0\), the graph has an inflection point there. Also, \(V(4)=84\), so the point is \((4, 84)\). On the graph, this is where the slope stops increasing and begins decreasing.
3. The rate \(V'(t)\) reaches its maximum at \(t=4\). Thus the maximum rate is \(V'(4)=24\,\text{m}^3/\text{h}\).
4. For \(0\le t<4\), \(V''(t)>0\), so the graph is concave up and the rate of change is increasing. For \(4<t\le10\), \(V''(t)<0\), so the graph is concave down and the rate of change is decreasing. Since \(V'(8)=0\), the volume increases through \(t=8\) and decreases after \(t=8\).
Answer
a) \((4, 84)\); the volume’s rate of increase is greatest there.
b) \(24\,\text{m}^3/\text{h}\)
c) Concave up for \(0\le t<4\) and concave down for \(4<t\le10\). The rate of change increases before \(t=4\) and decreases afterward; the volume begins decreasing after \(t=8\).