Aimathic
Login | English | Deutsch

Calculus math worksheets

Build your own math worksheets from 35,000+ problems for grades 3 to 12, from fractions to AP Calculus. Every problem comes with step-by-step solutions.

Functions and their derivative graphs

Learning goals

  • Determines increasing and decreasing intervals from the sign of the first derivative.
  • Determines intervals of concavity using derivative information.
  • Finds and classifies local extrema using derivatives.
  • Verifies an actual change in concavity before declaring an inflection point.
  • Matches graphs of a function and its successive derivatives.
  • Sketches a derivative graph from the slopes of a function graph.

Click problems to add them to your worksheet.

Functions and their derivative graphs 1
A function \(f\) satisfies \(f'(x)=\ln(3)\) for every real \(x\). Which candidate graph could represent \(f\)? Justify your choice.
Figure for problem 535011

Hints

- Determine whether the constant derivative is positive, negative, or zero. - A derivative that never changes value imposes a very specific shape on the original graph. - Use the sign of the derivative to decide which direction the graph must move.

Solution

1. Since \(3>1\), \(\ln(3)>0\). Thus \(f'\) is a positive constant. 2. A constant positive derivative means \(f\) is a line with constant positive slope. 3. Only graph a has that form, so graph a could represent \(f\).

Answer

Graph a
Functions and their derivative graphs 2
The graph of \(f''\) stays above the x-axis on \((-2,2)\). What can you say about the shape of \(f\) on this interval? Does this graph tell you whether \(f\) is increasing or decreasing?
Figure for problem 562369

Hints

- What does the sign of the second derivative tell you about tangent slopes? - Curving upward and moving upward are not the same thing. - Think of a U-shaped curve: how can it move on its left and right sides?

Solution

1. The graph shows \(f''(x)>0\) throughout \((-2,2)\). 2. Thus the slope \(f'(x)\) increases, and the graph of \(f\) is concave up. 3. Without knowing the sign of \(f'\), \(f\) may be increasing, decreasing, or change from decreasing to increasing.

Answer

The graph of \(f\) is concave up, and its tangent slopes increase. Whether \(f\) increases or decreases cannot be determined from \(f''\) alone.
Functions and their derivative graphs 3
On \((-2,2)\), a function satisfies \(f''(x)<0\). Which of the two curves could show the shape of \(f\) on that interval? Explain using tangent slopes.
Figure for problem 562370

Hints

- Think about how tangent slopes change as you move from left to right. - Which curve becomes less steep upward, then more steep downward? - Do not decide based only on whether a curve is rising or falling.

Solution

1. Negative second derivative means the tangent slopes decrease as x increases. 2. Curve a) opens downward and has decreasing tangent slopes. Curve b) opens upward and has increasing tangent slopes. 3. Therefore, curve a) fits the condition.

Answer

Curve a), because it bends downward and its tangent slopes decrease from left to right.
Functions and their derivative graphs 4
On \((0,4)\), a function satisfies \(f'(x)>0\) and \(f''(x)<0\). Describe how a possible graph of \(f\) moves and bends as you go from left to right.

Hints

- Interpret the first derivative before thinking about curvature. - What does a negative second derivative tell you about how slopes change? - Can a rising graph get flatter?

Solution

1. Since \(f'(x)>0\), the graph rises throughout the interval. 2. Since \(f''(x)<0\), its tangent slopes decrease; the graph bends downward. 3. Thus the graph rises but becomes less steep as x increases.

Answer

The graph rises and is concave down. Its positive slopes become smaller from left to right.
Functions and their derivative graphs 5
A function has \(f'(x)=2x\) and \(f(0)=3\). Which graph could be the graph of \(f\)?
Figure for problem 562372

Hints

- Which graphs have the tangent slopes of an upward-opening parabola? - Look at where each graph meets the y-axis. - A derivative determines shape but does not fix a vertical shift on its own.

Solution

1. A function with derivative \(2x\) is a vertical shift of \(x^2\), so it opens upward. 2. The point condition fixes its height: the graph must pass through \((0,3)\). 3. Graph a) opens upward and passes through \((0,3)\), so it is the correct choice.

Answer

Graph a).
Functions and their derivative graphs 6
Suppose \(f'(x)=x^2-1\) on \([-2,2]\). Which graph could be the graph of \(f\)? Decide by where each graph rises and falls.
Figure for problem 562373

Hints

- Find where the derivative changes sign. - Turn the derivative signs into a rise-fall pattern. - Which graph has a peak first and a valley second?

Solution

1. Factor \(f'(x)=(x-1)(x+1)\). It is positive for \(x<-1\) and \(x>1\), and negative for \(-1<x<1\). 2. A compatible function rises, then falls, then rises, with a local maximum at \(-1\) and a local minimum at \(1\). 3. Graph a) has this sequence. Graph b) falls, rises, then falls.

Answer

Graph a).
Functions and their derivative graphs 7
The graph shows two functions, \(f\) and \(g\). One graph represents a function, and the other represents its derivative. Decide which graph represents the function and which represents the derivative. Justify your answer.
Figure for problem 532349

Hints

- How are the critical numbers of a function related to the zeros of its derivative? - On which intervals is each graph increasing or decreasing? - What sign should the derivative have when the original function is increasing or decreasing? - Check both possible assignments.

Solution

1. The graph labeled \(f\) has a local maximum between \(x=-2\) and \(x=-1\), and a local minimum between \(x=1\) and \(x=2\). The graph labeled \(g\) is zero at those same x-coordinates. 2. The graph of \(f\) increases before the first critical number, decreases between the two critical numbers, and increases after the second critical number. Over those intervals, \(g\) is positive, negative, and positive, respectively. 3. Therefore, the values of \(g\) match the slopes of \(f\), so \(g=f'\).

Answer

The graph labeled \(f\) represents the function, and the graph labeled \(g\) represents its derivative. Thus, \(g=f'\).
Functions and their derivative graphs 8
The graph of \(f\) is shown. Decide whether each statement about \(f'\) is true or false, and briefly justify your answer. A) At \(x=0\), the derivative is positive because the graph passes through the origin. B) \(f'(-2)=0\) and \(f'(2)=0\). C) For every \(-2<x<2\), the graph of \(f'\) lies below the x-axis. D) The graph of \(f'\) is a downward-opening parabola.
Figure for problem 532353

Hints

- The derivative represents the slope of the graph at each input. - Relate increasing and decreasing behavior to the sign of the derivative. - At a smooth local maximum or minimum, the tangent is horizontal. - Compare the derivative's sign pattern with the opening direction of a parabola.

Solution

1. A is false. At \(x=0\), the graph of \(f\) is decreasing, so \(f'(0)<0\). Passing through the origin does not determine the derivative sign. 2. B is true. The graph has a local maximum at \(x=-2\) and a local minimum at \(x=2\), so both tangent lines are horizontal. 3. C is true. The function decreases throughout \((-2,2)\), so \(f'(x)<0\) on that interval. 4. D is false. The derivative is positive outside the two zeros and negative between them, which matches an upward-opening parabola.

Answer

A) False; \(f'(0)<0\) because \(f\) is decreasing there. B) True; both inputs are smooth extrema. C) True; \(f\) is decreasing on \((-2,2)\). D) False; the sign pattern matches an upward-opening parabola.
Functions and their derivative graphs 9
Figures 1 and 2 show a function \(f\) and its derivative \(f'\), but the two figures are not labeled by role. a) Identify which figure is \(f\) and which is \(f'\). Justify your choice using the relationship between horizontal tangents of \(f\) and zeros of \(f'\). b) Find \(f(2)\). c) Find the slope of \(f\) at \(x=-1\). d) Give one value \(a\) for which \(f(a)=1\). e) Find all values \(b\) for which the slope of \(f\) is \(3\).
Figure for problem 532355

Hints

- First decide which graph could be the derivative by comparing zeros on one graph with horizontal tangents on the other. - Only after identifying the roles should you read function values and derivative values. - A requested tangent slope is a requested value of \(f'\).

Solution

1. Figure 1 is \(f\) and Figure 2 is \(f'\). The turning points of Figure 1 occur at the same inputs where Figure 2 crosses the x-axis, which is the required function-derivative relationship. 2. From Figure 1, \(f(2)=-1\). 3. The slope at \(x=-1\) is \(f'(-1)\). Figure 2 gives \(f'(-1)=-1.5\). 4. Figure 1 passes through \((0,1)\), so \(a=0\) works. 5. A slope of \(3\) means \(f'(b)=3\). Figure 2 has value \(3\) at \(b=-2\) and \(b=2\).

Answer

a) Figure 1 is \(f\); Figure 2 is \(f'\). b) \(f(2)=-1\) c) \(-1.5\) d) \(a=0\) e) \(b=-2\) and \(b=2\)
Functions and their derivative graphs 10
The figure shows two graphs labeled \(k_1\) and \(k_2\). One graph represents a function \(f\), and the other represents its derivative \(f'\). a) Explain mathematically which graph represents \(f\) and which represents \(f'\). b) Use the graph to determine: - \(f(2)\) - \(f'(2)\) - \(f(3)\) - \(f'(1)\)
Figure for problem 532357

Hints

- Compare the turning points of one graph with the zeros of the other. - A differentiable function has derivative \(0\) at a smooth local maximum or minimum. - Compare where one graph increases or decreases with the sign of the other graph. - After identifying the graphs, read each requested value from the correct one.

Solution

1. The graph labeled \(k_1\) has a local maximum at \(x=1\) and a local minimum at \(x=3\). The graph labeled \(k_2\) is zero at those same x-values. Also, \(k_1\) decreases on \((1, 3)\), where \(k_2\) is negative. Therefore, \(k_1\) represents \(f\) and \(k_2\) represents \(f'\). 2. Reading the values from the graphs gives \(f(2)=2\), \(f'(2)=-1.5\), \(f(3)=1\), and \(f'(1)=0\).

Answer

a) \(k_1\) is the graph of \(f\), and \(k_2\) is the graph of \(f'\). b) \(f(2)=2\); \(f'(2)=-1.5\); \(f(3)=1\); \(f'(1)=0\)
Functions and their derivative graphs 11
The graph of \(f'\) is shown. Determine whether each statement about \(f\) is true or false. Justify your answers. a) The graph of \(f\) has a local minimum at \(x=-2\) and a local maximum at \(x=2\). b) The function \(f\) is strictly decreasing on \([-2,2]\). c) The graph of \(f\) has an inflection point at \(x=0\).
Figure for problem 532402

Hints

- Use the sign of \(f'\) for monotonicity and local extrema. - Use whether \(f'\) rises or falls for concavity. - Keep those two readings of the derivative graph separate.

Solution

1. Zeros and signs of \(f'\) determine critical points and monotonicity of \(f\), while local extrema of \(f'\) can indicate concavity changes of \(f\). 2. At \(x=-2\), \(f'\) changes from negative to positive, so \(f\) has a local minimum. At \(x=2\), \(f'\) changes from positive to negative, so \(f\) has a local maximum. Statement a is true. 3. On \((-2,2)\), \(f'(x)>0\), so \(f\) is strictly increasing, not decreasing. Statement b is false. 4. The graph of \(f'\) has a local maximum at \(x=0\), so \(f'\) changes from increasing to decreasing. Therefore \(f\) changes from concave up to concave down at \(x=0\). Statement c is true.

Answer

a) True. b) False. c) True.
Functions and their derivative graphs 12
The first coordinate plane shows the graph of \(f\). The other three planes show graphs \(A\), \(B\), and \(C\). One of them represents \(f'\). Which graph is \(f'\)? Justify your choice.
Figure for problem 532420

Hints

- Find the inputs where \(f\) has horizontal tangents. - The derivative is zero at those inputs. - Determine where \(f\) is decreasing. - The derivative must be negative on decreasing intervals.

Solution

1. The graph of \(f\) has a local maximum at \(x=-2\) and a local minimum at \(x=2\). Therefore, \(f'(-2)=0\) and \(f'(2)=0\). This eliminates graph \(C\), which has only one zero. 2. The graph of \(f\) decreases between \(-2\) and \(2\), so \(f'(x)<0\) on that interval. 3. Graph \(A\) is below the x-axis between its zeros at \(-2\) and \(2\), while graph \(B\) is above the x-axis there. Therefore, graph \(A\) represents \(f'\).

Answer

Graph \(A\) represents \(f'\).
Functions and their derivative graphs 13
The graph of \(f\) is shown with four candidate graphs, \(A\), \(B\), \(C\), and \(D\). Which candidate represents \(f'\)? Justify your choice by comparing key features.
Figure for problem 532421

Hints

- Locate the horizontal tangents of \(f\). - The derivative has zeros at those x-coordinates. - Determine where \(f\) is increasing and decreasing. - Eliminate candidates using both zeros and sign.

Solution

1. The graph of \(f\) has a local maximum at \(x=-1\) and a local minimum at \(x=3\). Thus, \(f'(-1)=0\) and \(f'(3)=0\). This eliminates \(C\), whose zeros are different, and \(D\), which has only one zero. 2. The function decreases between \(-1\) and \(3\), so \(f'(x)<0\) on that interval. 3. Only graph \(A\) has zeros at \(-1\) and \(3\) and is negative between them. Therefore, graph \(A\) represents \(f'\).

Answer

Graph \(A\) represents \(f'\).
Functions and their derivative graphs 14
Panel a) shows the graphs labeled \(f_1\) and \(f_2\). Panel b) shows two possible derivative graphs, labeled \(p\) and \(q\). a) Match each function, \(f_1\) and \(f_2\), with its derivative, \(p\) or \(q\). Justify your choices. b) On the displayed interval \([-3.5, 3.5]\), find the intervals where \(f_1\) is strictly increasing and strictly decreasing.
Figure for problem 532434

Hints

- Match the zeros of a derivative with the horizontal tangents of its function. - Compare the sign of each possible derivative with where the function increases or decreases. - Use the critical \(x\)-values as interval endpoints.

Solution

1. The graph of \(f_1\) has a local maximum at \(x=-2\) and a local minimum at \(x=2\), so its derivative must be zero at those values. 2. Between the two critical numbers, \(f_1\) decreases, so its derivative must be negative there. Graph \(p\) is negative between its zeros, while graph \(q\) is positive. Therefore, \(f_1'=p\) and \(f_2'=q\). 3. Graph \(p\) is positive on \([-3.5, -2)\) and \((2, 3.5]\), and negative on \((-2, 2)\). Thus, \(f_1\) is strictly increasing on \([-3.5, -2]\) and \([2, 3.5]\), and strictly decreasing on \([-2, 2]\).

Answer

a) \(f_1 \rightarrow p\) and \(f_2 \rightarrow q\) b) Increasing on \([-3.5, -2]\) and \([2, 3.5]\); decreasing on \([-2, 2]\).
Functions and their derivative graphs 15
The two figures show the graphs of a function \(f\) and its derivative \(f'\). a) Use increasing and decreasing behavior to decide which figure shows \(f\) and which shows \(f'\). b) Find the interval on which \(f\) is strictly decreasing. How is this shown on the graph of \(f'\)? c) Use the derivative graph to determine the slope of the tangent to \(f\) at \(x = 0\).
Figure for problem 532520

Hints

- Compare where the function increases or decreases with the sign of the derivative. - The zeros of the derivative occur at horizontal tangents of the function. - The value \(f'(0)\) is the slope of \(f\) at \(x = 0\).

Solution

1. Figure 1 represents \(f\), and Figure 2 represents \(f'\). Figure 1 increases for \(x < -1\), decreases for \(-1 < x < 3\), and increases for \(x > 3\). Over the same intervals, Figure 2 is positive, negative, and positive. 2. The function \(f\) is strictly decreasing on \([-1, 3]\). The derivative graph is below the \(x\)-axis for \(-1 < x < 3\) and is zero at the endpoints. 3. The tangent slope at \(x = 0\) is \(f'(0)\). From Figure 2, \(f'(0) = -0.75\).

Answer

a) Figure 1 shows \(f\), and Figure 2 shows \(f'\). b) \([-1, 3]\); the graph of \(f'\) is below the \(x\)-axis between \(-1\) and \(3\). c) \(-0.75\)
Functions and their derivative graphs 16
The graph of \(f\) is shown. Answer each question about \(f'\) by reading and reasoning from the graph. a) Find the zeros of \(f'\). Briefly explain your method. b) Give the interval on which the graph of \(f'\) lies above the x-axis. c) Estimate \(f'(0)\) from the tangent slope at \(x=0\). Because this is a graph-based estimate, values from about \(1.3\) to \(1.7\) are acceptable.
Figure for problem 532526

Hints

- Look for inputs where the graph of \(f\) has horizontal tangents. - Relate increasing behavior of \(f\) to the sign of \(f'\). - For the estimate at \(x=0\), imagine a tangent line and use two convenient points to form a slope triangle.

Solution

1. The graph of \(f\) has a local minimum at \(x=-1\) and a local maximum at \(x=1\). Therefore, the zeros of \(f'\) are \(x=-1\) and \(x=1\). 2. The graph of \(f\) increases between the two extrema, so \(f'(x)>0\) for \(-1<x<1\). 3. At \(x=0\), a reasonable tangent estimate uses \((0,1)\) and approximately \((1,2.5)\), giving \(f'(0)\approx\frac{2.5-1}{1-0}=1.5\). Values from about \(1.3\) to \(1.7\) are consistent with the displayed graph.

Answer

a) \(x=-1\) and \(x=1\) b) \((-1,1)\) c) Approximately \(1.5\); estimates from about \(1.3\) to \(1.7\) are acceptable.
Functions and their derivative graphs 17
Figure 1 shows the graphs of two polynomial functions, \(f\) and \(g\). Figure 2 shows two derivative graphs, \(p\) and \(q\). a) Match each function, \(f\) and \(g\), with its derivative, \(p\) or \(q\). b) Justify your matches using features such as local maxima and minima, zeros, and increasing and decreasing behavior.
Figure for problem 532541

Hints

- Differentiation lowers the degree of a polynomial by one. - Match local extrema of a function with zeros of its derivative. - Compare where each function increases or decreases with the sign of each derivative graph.

Solution

1. The graph of \(f\) has a local maximum at \(x=-1\) and a local minimum at \(x=3\). Graph \(p\) is zero at those same values. It is negative between them, where \(f\) decreases, and positive outside them, where \(f\) increases. Therefore, \(f'=p\). 2. The graph of \(g\) has a local maximum at \(x=2\). Graph \(q\) is zero there, positive for \(x<2\), where \(g\) increases, and negative for \(x>2\), where \(g\) decreases. Therefore, \(g'=q\).

Answer

a) \(f\rightarrow p\) and \(g\rightarrow q\) b) The zeros and signs of \(p\) match the critical numbers and monotonicity of \(f\), while the zero and signs of \(q\) match those of \(g\).
Functions and their derivative graphs 18
The graph shown is the first derivative \(f'\) of a polynomial function \(f\) on \(-5\le x\le6\). a) Determine the intervals on which \(f\) is concave up and concave down. b) Find the x-coordinates of all inflection points of \(f\).
Figure for problem 532547

Hints

- Identify where the graph of \(f'\) is increasing and decreasing. - How does an increasing or decreasing first derivative determine concavity? - Inflection-point x-coordinates of \(f\) occur where the monotonicity of \(f'\) changes.

Solution

1. The function \(f\) is concave up where \(f'\) is increasing and concave down where \(f'\) is decreasing. 2. On the displayed interval, \(f'\) is increasing on \([-5, -1)\) and \((3, 6]\). Therefore, \(f\) is concave up on those intervals. 3. The graph of \(f'\) is decreasing on \((-1, 3)\). Therefore, \(f\) is concave down on that interval. 4. The monotonicity of \(f'\) changes at its local extrema, \(x=-1\) and \(x=3\). Thus these are the x-coordinates of the inflection points of \(f\).

Answer

a) Concave up on \([-5, -1)\) and \((3, 6]\); concave down on \((-1, 3)\). b) \(x=-1\) and \(x=3\)
Functions and their derivative graphs 19
The graph of a function \(f\) is shown. For each marked point \(A\), \(B\), \(C\), and \(D\), determine whether the function value \(f(x)\), first derivative \(f'(x)\), and second derivative \(f''(x)\) are positive, negative, or zero. Enter your results in the table. <table border="1" style="border-collapse: collapse; text-align: center; width: 100%; max-width: 500px; margin-top: 10px;"> <thead> <tr> <th style="padding: 5px 10px;">Point</th> <th style="padding: 5px 10px;">\(f(x)\)</th> <th style="padding: 5px 10px;">\(f'(x)\)</th> <th style="padding: 5px 10px;">\(f''(x)\)</th> </tr> </thead> <tbody> <tr> <td style="padding: 5px 10px;">\(A\)</td> <td style="padding: 5px 10px;">\(\square\)</td> <td style="padding: 5px 10px;">\(\square\)</td> <td style="padding: 5px 10px;">\(\square\)</td> </tr> <tr> <td style="padding: 5px 10px;">\(B\)</td> <td style="padding: 5px 10px;">\(\square\)</td> <td style="padding: 5px 10px;">\(\square\)</td> <td style="padding: 5px 10px;">\(\square\)</td> </tr> <tr> <td style="padding: 5px 10px;">\(C\)</td> <td style="padding: 5px 10px;">\(\square\)</td> <td style="padding: 5px 10px;">\(\square\)</td> <td style="padding: 5px 10px;">\(\square\)</td> </tr> <tr> <td style="padding: 5px 10px;">\(D\)</td> <td style="padding: 5px 10px;">\(\square\)</td> <td style="padding: 5px 10px;">\(\square\)</td> <td style="padding: 5px 10px;">\(\square\)</td> </tr> </tbody> </table>
Figure for problem 532552

Hints

- How does a point’s position relative to the x-axis determine the sign of \(f(x)\)? - What does the tangent slope tell you about the sign of \(f'(x)\)? - What is special about the tangent at a local maximum or minimum? - How does concavity determine the sign of \(f''(x)\)? - What happens to concavity at an inflection point?

Solution

1. Use each point’s position relative to the x-axis to determine the sign of \(f(x)\): \(f(x_A)<0\), \(f(x_B)>0\), \(f(x_C)>0\), and \(f(x_D)<0\). 2. Use the tangent slope to determine the sign of \(f'(x)\). The graph is increasing at \(A\), has a horizontal tangent at the local maximum \(B\), is decreasing at \(C\), and has a horizontal tangent at the local minimum \(D\). Therefore, \(f'(x_A)>0\), \(f'(x_B)=0\), \(f'(x_C)<0\), and \(f'(x_D)=0\). 3. Use concavity to determine the sign of \(f''(x)\). The graph is concave down at \(A\) and \(B\), changes concavity at \(C\), and is concave up at \(D\). Therefore, \(f''(x_A)<0\), \(f''(x_B)<0\), \(f''(x_C)=0\), and \(f''(x_D)>0\).

Answer

The completed table is: <table border="1" style="border-collapse: collapse; text-align: center; margin-top: 10px;"> <thead> <tr> <th style="padding: 5px 10px; background-color: #f2f2f2;">Point</th> <th style="padding: 5px 10px; background-color: #f2f2f2;">\(f(x)\)</th> <th style="padding: 5px 10px; background-color: #f2f2f2;">\(f'(x)\)</th> <th style="padding: 5px 10px; background-color: #f2f2f2;">\(f''(x)\)</th> </tr> </thead> <tbody> <tr> <td style="padding: 5px 10px; font-weight: bold;">\(A\)</td> <td style="padding: 5px 10px; color: red;">negative (\(<0\))</td> <td style="padding: 5px 10px; color: green;">positive (\(>0\))</td> <td style="padding: 5px 10px; color: red;">negative (\(<0\))</td> </tr> <tr> <td style="padding: 5px 10px; font-weight: bold;">\(B\)</td> <td style="padding: 5px 10px; color: green;">positive (\(>0\))</td> <td style="padding: 5px 10px;">zero (\(=0\))</td> <td style="padding: 5px 10px; color: red;">negative (\(<0\))</td> </tr> <tr> <td style="padding: 5px 10px; font-weight: bold;">\(C\)</td> <td style="padding: 5px 10px; color: green;">positive (\(>0\))</td> <td style="padding: 5px 10px; color: red;">negative (\(<0\))</td> <td style="padding: 5px 10px;">zero (\(=0\))</td> </tr> <tr> <td style="padding: 5px 10px; font-weight: bold;">\(D\)</td> <td style="padding: 5px 10px; color: red;">negative (\(<0\))</td> <td style="padding: 5px 10px;">zero (\(=0\))</td> <td style="padding: 5px 10px; color: green;">positive (\(>0\))</td> </tr> </tbody> </table>
Functions and their derivative graphs 20
The graph shown is the second derivative \(f''\) of a polynomial function \(f\) on \(-4\le x\le4\). a) Determine the intervals where \(f\) is concave up and concave down. b) Find the x-coordinates of the inflection points of \(f\) and justify your answer. c) Evaluate the statement: “The graph of the first derivative \(f'\) has a local extremum at \(x=0\).”
Figure for problem 532556

Hints

- How does the sign of the second derivative determine concavity? - An inflection point requires a change in the sign of the second derivative. - What condition must hold for the first derivative to have a local extremum?

Solution

1. The graph of \(f''\) is above the x-axis on \([-4, -2)\) and \((2, 4]\). Therefore, \(f\) is concave up on those intervals. It is below the x-axis on \((-2, 2)\), so \(f\) is concave down there. 2. At \(x=-2\) and \(x=2\), the second derivative is zero and changes sign. Therefore, these are the x-coordinates of the inflection points of \(f\). 3. The statement is false. A local extremum of \(f'\) at \(x=0\) would require \(f''(0)=0\). The graph shows \(f''(0)=-4\), so \(f'\) does not have a local extremum there.

Answer

a) Concave up on \([-4, -2)\) and \((2, 4]\); concave down on \((-2, 2)\). b) \(x=-2\) and \(x=2\) c) False, because \(f''(0)=-4\ne0\).
Functions and their derivative graphs 21
A differentiable function \(f\) is strictly increasing for \(x<-1\) and \(x>3\), and strictly decreasing for \(-1<x<3\), within the displayed interval \([-4,4]\). Which graph, I, II, or III, could represent \(f'\)? Justify your answer.
Figure for problem 532576

Hints

- Use the turning points to find inputs where a differentiable function must have derivative zero. - Ask which derivative signs are compatible with the given intervals of increase and decrease. - What does strict increase tell you about an interval, and what must hold at individual points?

Solution

1. Because \(f\) has a local maximum at \(-1\) and a local minimum at \(3\), and is differentiable there, \(f'(-1)=f'(3)=0\). 2. Where \(f\) is increasing, its derivative is nonnegative; where it is decreasing, its derivative is nonpositive. Strict increase alone does not require \(f'>0\) at every point. 3. Graph I has the required zeros and a compatible positive-negative-positive sign pattern. Graph II reverses the signs, and graph III has different zeros. 4. Thus, graph I could represent \(f'\).

Answer

Graph I. Its zeros at \(x=-1\) and \(x=3\) match the turning points of \(f\), and its signs agree with the given intervals of increase and decrease. II has the opposite signs; III has different zeros.
Functions and their derivative graphs 22
The panel labeled \(f'\) shows the graph of \(f'\). Panels 1, 2, and 3 show three candidate graphs for \(f\). a) Which candidate represents \(f\)? b) Explain why the other two candidates cannot represent \(f\).
Figure for problem 532603

Hints

- Zeros of the derivative correspond to critical numbers of the original function. - The sign of the derivative determines increasing and decreasing intervals. - Check both the critical numbers and the direction of each sign change.

Solution

1. The derivative graph has zeros at \(x=1\) and \(x=3\), so \(f\) must have critical numbers at those x-values. 2. Candidate 2 has extrema at \(x=0\) and \(x=2\), so it cannot be \(f\). 3. For \(x<1\), \(f'(x)>0\), so \(f\) must be increasing. Candidate 1 increases before \(x=1\) and has a local maximum there because \(f'\) changes from positive to negative. 4. Candidate 3 decreases before \(x=1\), which contradicts \(f'(x)>0\). Therefore, candidate 1 represents \(f\).

Answer

a) Candidate 1. b) Candidate 2 has critical numbers at the wrong x-values, and candidate 3 has the wrong monotonicity.
Functions and their derivative graphs 23
The graph of \(g'\) is shown. a) Use the graph to identify the x-coordinates and types of the local extrema of \(g\). b) A candidate function is \(g(x)=-\frac{1}{18}x^3+1.5x+1\). Differentiate it to verify that its derivative matches the displayed graph. c) Find the coordinates of the local maximum and local minimum of this \(g\), and confirm that they agree with part a).
Figure for problem 532604

Hints

- Use derivative zeros and sign changes for part a). - Verify the candidate function by differentiating it, not by reversing differentiation. - Substitute the critical x-values into the verified function to get coordinates.

Solution

1. The zeros of \(g'\) are \(x=-3\) and \(x=3\). At \(x=-3\), \(g'\) changes from negative to positive, so \(g\) has a local minimum. At \(x=3\), \(g'\) changes from positive to negative, so \(g\) has a local maximum. 2. Differentiating \(g(x)=-\frac{1}{18}x^3+1.5x+1\) gives \(g'(x)=-\frac16x^2+1.5\), which matches the displayed derivative. 3. \(g(-3)=-2\) and \(g(3)=4\). Therefore, the local minimum is \((-3,-2)\), and the local maximum is \((3,4)\).

Answer

a) Local minimum at \(x=-3\); local maximum at \(x=3\). b) \(g'(x)=-\frac16x^2+1.5\), matching the graph. c) Local minimum \((-3,-2)\); local maximum \((3,4)\).
Functions and their derivative graphs 24
The graph shows two curves labeled \(p\) and \(q\). One is a function \(f\), and the other is its derivative \(f'\). a) Identify which curve is \(f\) and which is \(f'\). Justify your choice by comparing the minimum of one curve with a zero of the other. b) Use the correctly identified derivative curve to find the slope of the tangent to \(f\) at \(x=0\): \(-2\), \(-1\), or \(0\). c) Find the \(x\)-values where \(f(x)=f'(x)\).
Figure for problem 532668

Hints

- A smooth minimum of \(f\) must occur where \(f'\) is zero. - Identify the roles of the two curves before reading the requested slope. - Equal function and derivative values occur where the two curves intersect.

Solution

1. Curve \(p\) is \(f\), and curve \(q\) is \(f'\). Curve \(p\) has a minimum at \(x=1\), while curve \(q\) has value \(0\) there, as a derivative must at a smooth minimum. 2. At \(x=0\), curve \(q\) has value \(-1\), so the tangent slope is \(f'(0)=-1\). 3. The function and derivative have equal values where curves \(p\) and \(q\) intersect. The intersections occur at \(x=1\) and \(x=3\).

Answer

a) \(p=f\) and \(q=f'\) b) \(-1\) c) \(x=1\) and \(x=3\)
Functions and their derivative graphs 25
The three panels show the graphs of a function \(f\), its first derivative \(f'\), and its second derivative \(f''\). Match \(f\), \(f'\), and \(f''\) with graphs a, b, and c. Justify your matches.
Figure for problem 532770

Hints

- At a local maximum or minimum, the first derivative is zero. - Compare where one graph increases or decreases with where a candidate derivative is positive or negative. - Build a two-step derivative chain among the three graphs.

Solution

1. Graph b has a local maximum at \(x=0\). Its derivative must be zero there and change from positive to negative. Graph c has exactly that behavior, so graph c is the derivative of graph b. 2. Graph c has a local minimum at \(x=1\) and a local maximum at \(x=3\). Its derivative must have zeros at \(x=1\) and \(x=3\). Graph a has those zeros and its sign matches the increasing/decreasing behavior of graph c. Therefore, graph a is the derivative of graph c. 3. The derivative chain is graph b \(\to\) graph c \(\to\) graph a. Hence graph b is \(f\), graph c is \(f'\), and graph a is \(f''\).

Answer

Graph a: \(f''\); graph b: \(f\); graph c: \(f'\).
Functions and their derivative graphs 26
The graph of \(f\) is shown. Which statements about the derivative \(f^{\prime}\) are true? Justify each decision. (A) \(f^{\prime}(0)=0\). (B) \(f^{\prime}(2)\) is approximately \(-1\). (C) The derivative \(f^{\prime}\) is strictly decreasing throughout the displayed interval. (D) For \(x<0\), the graph of \(f^{\prime}\) lies below the x-axis.
Figure for problem 533685

Hints

- The derivative at an input is the tangent slope there. - A smooth local extremum has a horizontal tangent line. - Use increasing and decreasing behavior to determine the sign of the derivative. - Use concavity to determine whether derivative values are increasing or decreasing.

Solution

1. Statement (A) is true. The graph has a local maximum at \(x=0\), so its tangent line is horizontal and \(f^{\prime}(0)=0\). 2. Statement (B) is true. A tangent-line estimate at \(x=2\) gives a slope of about \(-1\), so \(f^{\prime}(2)\approx-1\). 3. Statement (C) is true. The graph is concave down throughout the displayed interval, so its tangent slopes continually decrease. Therefore, \(f^{\prime}\) is strictly decreasing. 4. Statement (D) is false. For \(x<0\), the graph of \(f\) is increasing, so \(f^{\prime}(x)>0\) and the derivative graph lies above the x-axis.

Answer

(A) True (B) True (C) True (D) False
Functions and their derivative graphs 27
The graph shows the functions labeled \(f\) and \(g\). Use the local extremum of \(f\) and the zeros of \(g\) to explain why \(g\) cannot be the derivative of \(f\).
Figure for problem 533687

Hints

- What must the derivative equal at a smooth local maximum or minimum? - Compare the \(x\)-coordinate of the vertex of \(f\) with the zeros of \(g\).

Solution

1. The graph of \(f\) has a local minimum at \(x=0\). 2. If \(g=f'\), then \(g(0)\) would have to equal \(0\), because the tangent to \(f\) is horizontal at a smooth local minimum. 3. The graph shows \(g(0)=1\), not \(0\). Therefore, \(g\) cannot be the derivative of \(f\).

Answer

The function \(f\) has a local minimum at \(x = 0\), so its derivative must be \(0\) there. Since \(g(0) = 1\), \(g\) cannot equal \(f'\).
Functions and their derivative graphs 28
The graphs show the functions labeled \(f\) and \(g\). Explain why \(f\) cannot be the derivative of \(g\). Focus on the behavior of \(g\) for \(x>0\).
Figure for problem 533688

Hints

- What sign must a derivative have where its function is decreasing? - Compare that sign with the graph of \(f\) for \(x>0\).

Solution

1. For \(x>0\), the graph of \(g\) is strictly decreasing. 2. If \(f=g'\), then \(f(x)\) would have to be negative wherever \(g\) is decreasing. 3. For \(x>0\), the graph of \(f\) is above the x-axis, so \(f(x)>0\). This contradicts the required sign of the derivative. Therefore, \(f\) cannot be the derivative of \(g\).

Answer

For \(x > 0\), \(g\) is decreasing, so its derivative must be negative. Since \(f(x) > 0\) in that region, \(f\) cannot equal \(g'\).
Functions and their derivative graphs 29
The graph of a quadratic function \(f\) is shown. 1) Find the input where the graph of \(f^{\prime}\) crosses the x-axis. 2) Find an equation for the graph of \(f^{\prime}\). Describe how the sign of \(f^{\prime}(x)\) changes at its zero.
Figure for problem 533693

Hints

- The derivative is zero where the original graph has a horizontal tangent line. - Determine where \(f\) is increasing and decreasing. - The derivative of a quadratic function is linear.

Solution

1. The derivative is zero where the graph of \(f\) has a horizontal tangent line. The vertex occurs at \(x=0\), so \(f^{\prime}(0)=0\). 2. The graph of \(f\) is a downward-opening parabola. It increases for \(x<0\), so \(f^{\prime}(x)>0\), and decreases for \(x>0\), so \(f^{\prime}(x)<0\). From the vertex \((0,2)\) and the point \((2,0)\), write \(f(x)=ax^2+2\) and solve \(0=4a+2\), giving \(a=-0.5\). Thus, \(f(x)=-0.5x^2+2\) and \(f^{\prime}(x)=-x\). The derivative graph is a decreasing line through the origin, crossing the x-axis from positive values to negative values.

Answer

1) The zero of \(f^{\prime}\) is \(x=0\). 2) The graph is the line \(y=-x\). The derivative is positive for \(x<0\) and negative for \(x>0\).
Functions and their derivative graphs 30
The graph of a translated parabola \(f\) is shown. 1) At what input does the graph of \(f^{\prime}\) cross the x-axis? 2) Use the monotonicity of \(f\) to determine whether \(f^{\prime}(x)\) is positive or negative for \(x>2\).
Figure for problem 533694

Hints

- At the vertex of a smooth parabola, the tangent line is horizontal. - The derivative is positive where the function is increasing.

Solution

1. The graph of \(f\) has its minimum at \(x=2\). The tangent line is horizontal there, so \(f^{\prime}(2)=0\). Thus, the derivative graph crosses the x-axis at \(x=2\). 2. For \(x>2\), the graph of \(f\) is increasing. Therefore, its tangent slopes are positive and \(f^{\prime}(x)>0\).

Answer

1) \(x=2\) 2) \(f^{\prime}(x)>0\) for \(x>2\).
Functions and their derivative graphs 31
The graph of \(f\) is shown. 1) Find the x-coordinates where the graph of \(f^{\prime}\) crosses the x-axis. 2) On what interval is \(f^{\prime}\) negative? Justify your answer using the behavior of \(f\).
Figure for problem 533695

Hints

- Locate the local maximum and local minimum. - The derivative is zero where the tangent line is horizontal. - The derivative is negative where the function is decreasing.

Solution

1. The derivative is zero at the local extrema of \(f\). The graph has a local maximum at \(x=-2\) and a local minimum at \(x=2\). Therefore, the derivative graph crosses the x-axis at \(x=-2\) and \(x=2\). 2. The graph of \(f\) is decreasing between the local maximum and local minimum. Therefore, \(f^{\prime}(x)<0\) for \(-2<x<2\).

Answer

1) \(x=-2\) and \(x=2\) 2) \(f^{\prime}(x)<0\) on \((-2,2)\).
Functions and their derivative graphs 32
The graph of a quadratic function \(f\) is shown. Determine the graph of \(f^{\prime}\), beginning by finding the input where the slope of \(f\) is zero.
Figure for problem 533719

Hints

- Find the horizontal tangent line on the parabola. - Estimate tangent slopes at one or two additional inputs. - The derivative of a quadratic function is linear. - Use the increasing and decreasing intervals to check the sign of the derivative graph.

Solution

1. The graph of \(f\) has a minimum at \(x=2\), so \(f^{\prime}(2)=0\). 2. From the graph, the tangent slope is about \(-2\) at \(x=0\) and about \(2\) at \(x=4\). 3. Since \(f\) is quadratic, \(f^{\prime}\) is linear. The line through \((0,-2)\), \((2,0)\), and \((4,2)\) is \(f^{\prime}(x)=x-2\).

Answer

The derivative graph is the line \(f^{\prime}(x)=x-2\). It crosses the x-axis at \(x=2\) and passes through \((0,-2)\).
Functions and their derivative graphs 33
The graph shown is the derivative \(f'\) of a function \(f\). Determine whether each statement is true or false, and briefly justify your answer. a) On the displayed domain, \(f\) is decreasing for \(-2<x\le5\). b) The function \(f\) has a local extremum at \(x=3\). c) The function \(f\) has an inflection point at \(x=3\). d) The slope of \(f\) at \(x=1\) is positive.
Figure for problem 533799

Hints

- Use the sign of \(f'\) to determine monotonicity. - A local extremum of \(f\) requires a sign change in \(f'\). - Local extrema of \(f'\) correspond to inflection points of \(f\). - The slope of \(f\) at a point is the value of \(f'\) there.

Solution

1. Statement a is true. For \(-2<x\le5\), \(f'(x)\le0\), and the derivative is zero only at \(x=3\). Therefore, \(f\) is strictly decreasing there. 2. Statement b is false. At \(x=3\), \(f'\) does not change sign, so \(f\) has no local extremum. 3. Statement c is true. The graph of \(f'\) has a local maximum at \(x=3\), so the concavity of \(f\) changes there. 4. Statement d is false. The graph shows \(f'(1)<0\), so the slope of \(f\) at \(x=1\) is negative.

Answer

a) True b) False c) True d) False
Functions and their derivative graphs 34
The graphs labeled \(g_1\) and \(g_2\) represent the first derivative \(f'\) and second derivative \(f''\) of a function \(f\). a) Match \(g_1\) and \(g_2\) with \(f'\) and \(f''\). b) On which interval is the graph of \(f\) concave up? Use the graph of \(f''\) to explain.
Figure for problem 533805

Hints

- Decide which graph can be the derivative of the other. - A function is concave up where its second derivative is positive.

Solution

1. The graph \(g_1\) is cubic, and its derivative is the quadratic graph \(g_2\). Therefore, \(g_1=f'\) and \(g_2=f''\). 2. The graph \(g_2\) lies above the x-axis between its zeros at \(x=-2\) and \(x=2\). Hence \(f''(x)>0\) on \((-2, 2)\), so the graph of \(f\) is concave up there.

Answer

a) \(g_1=f'\) and \(g_2=f''\) b) \((-2, 2)\)
Functions and their derivative graphs 35
The graph shows the derivative \(f'\) of a function \(f\). Answer the following questions about \(f\): 1. How many local extrema does \(f\) have in the displayed interval? 2. At which \(x\)-value does \(f\) have a local minimum? 3. How many inflection points does the graph of \(f\) have?
Figure for problem 533816

Hints

- Count the zeros of \(f'\) where the sign changes. - A change from negative to positive gives a local minimum. - Count the local extrema of \(f'\) to determine the number of inflection points of \(f\).

Solution

1. Local extrema of \(f\) occur where \(f'\) is zero and changes sign. This happens at \(x = -2\), \(x = 0\), and \(x = 2\), so \(f\) has three local extrema. 2. At \(x = -2\), \(f'\) changes from positive to negative, giving a local maximum. At \(x = 0\), it changes from negative to positive, giving a local minimum. At \(x = 2\), it changes from positive to negative, giving a local maximum. 3. Inflection points of \(f\) occur where \(f'\) has local extrema. The derivative graph has exactly two local extrema in the displayed interval, so \(f\) has two inflection points.

Answer

1. Three local extrema 2. A local minimum at \(x = 0\) 3. Two inflection points
Functions and their derivative graphs 36
Two graphs, \(p\) and \(q\), show a quadratic function \(f\) and its derivative \(f'\), in some order. a) Identify \(f\) and \(f'\). Justify your choice using the graphs. b) Use the graph to find the tangent line to \(f\) at \(x=2\).
Figure for problem 533847

Hints

- Where does the parabola have a horizontal tangent? - The derivative graph should have a zero at that input. - Find the point and slope of the tangent at the requested input.

Solution

1. Graph \(p\) is the parabola \(f\), and graph \(q\) is its derivative \(f'\). 2. Graph \(p\) has a minimum at \(x=0\), where graph \(q\) crosses the x-axis, as expected for a derivative. 3. From the graphs, \(f(2)=0\) and \(f'(2)=1\). 4. The tangent through \((2,0)\) with slope \(1\) is \(y=x-2\).

Answer

a) \(p=f\), \(q=f'\); the derivative is zero where the parabola has its minimum. b) \(y=x-2\)
Functions and their derivative graphs 37
Two graphs, \(p\) and \(q\), show a periodic function \(f\) and its derivative \(f'\), in some order. a) Identify \(f\) and \(f'\). Justify your choice. b) Use the graphs to find the tangent line to \(f\) at \(x=0\).
Figure for problem 533848

Hints

- Compare the extrema of one graph with the zeros of the other. - The derivative is zero at a smooth local maximum or minimum. - Read both the function value and derivative value at \(x=0\).

Solution

1. Graph \(p\) is \(f\) and graph \(q\) is \(f'\). 2. At the maxima and minima of \(p\), graph \(q\) crosses the x-axis, consistent with zero derivative at smooth turning points. 3. At \(x=0\), graph \(p\) gives \(f(0)=0\), while graph \(q\) gives \(f'(0)=2\). 4. The tangent through \((0,0)\) with slope \(2\) is \(y=2x\).

Answer

a) \(p=f\), \(q=f'\); the zeros of \(q\) occur at extrema of \(p\). b) \(y=2x\)
Functions and their derivative graphs 38
The figure shows graphs labeled \(A\) and \(B\). One graph represents a function \(f\), and the other represents its derivative \(f'\). Use two characteristic features of the graphs to identify each one.
Figure for problem 533873

Hints

- Compare the local extremum of one graph with the zero of the other. - Compare increasing and decreasing intervals with the sign of the possible derivative.

Solution

1. Graph \(A\) has a local maximum at \(x=0\), and graph \(B\) is zero at \(x=0\). This matches the fact that the derivative is zero at a smooth local extremum. 2. For \(x>0\), graph \(A\) decreases, and graph \(B\) is below the x-axis. This matches the fact that a derivative is negative where its function decreases. 3. Therefore, graph \(A\) represents \(f\), and graph \(B\) represents \(f'\).

Answer

Graph A represents \(f\), and graph B represents \(f'\). The zero of graph B matches the local maximum of graph A, and the sign of graph B matches where graph A increases or decreases.
Functions and their derivative graphs 39
The graph of a function \(f\) is shown; no formula is given. Describe \(f'\) over the displayed interval: Is it positive or negative? Does it increase or decrease from left to right? Does it have any zeros? What happens to the tangent slopes toward the left edge of the graph?
Figure for problem 533899

Hints

- Decide whether the curve rises or falls as you move right. - Compare the steepness at different points on the graph. - Describe only the interval that is shown; do not assume the graph continues in the same way forever.

Solution

1. The graph rises throughout the displayed interval, so the visible tangent slopes are positive. Thus \(f'>0\) and \(f'\) has no zeros in this interval. 2. The graph becomes steeper from left to right, so the tangent slopes increase. Hence \(f'\) is increasing over the displayed interval. 3. Toward the left edge, the curve becomes less steep, with small positive tangent slopes. A finite graph does not establish the behavior as \(x\to-\infty\).

Answer

Over the displayed interval, \(f'\) is positive, increasing, and has no zeros. Toward the left edge, its values are small and positive.
Functions and their derivative graphs 40
The graph of \(f(x)=\frac{3}{x}\) is shown. Determine the sign of the tangent-slope function \(f^{\prime}\) on each interval \(x<0\) and \(x>0\). Justify your answer using the graph.
Figure for problem 533901

Hints

- Determine whether each branch is increasing or decreasing. - A decreasing function has negative tangent slopes. - Remember that \(x=0\) is not in the domain.

Solution

1. For \(x<0\), the left branch of \(f\) is strictly decreasing. Therefore, every tangent slope is negative and \(f^{\prime}(x)<0\). 2. For \(x>0\), the right branch is also strictly decreasing. Therefore, every tangent slope is negative and \(f^{\prime}(x)<0\). 3. Thus, the derivative graph lies below the x-axis at every input in the domain, \(x\ne0\).

Answer

For both \(x<0\) and \(x>0\), \(f^{\prime}(x)<0\).
Functions and their derivative graphs 41
On the branch for \(x>0\), describe the sign of \(f'\) and how its values change as \(x\) increases. Explain what happens to the tangent slopes toward the right edge of the graph.
Figure for problem 533902

Hints

- Look at whether the right-hand branch rises or falls. - Compare the tangent slopes at small and large positive x-values. - Explain only what the displayed graph supports.

Solution

1. On the right-hand branch, the graph rises, so its tangent slopes are positive: \(f'>0\). 2. The graph becomes flatter from left to right, so the positive slopes decrease. Thus \(f'\) decreases while staying above the x-axis. 3. Toward the right edge, the slopes are positive and small. The finite graph alone does not establish a limit as \(x\to\infty\).

Answer

For the displayed positive x-values, \(f'>0\) and decreases as \(x\) increases. Toward the right edge, the tangent slopes are small and positive.
Functions and their derivative graphs 42
The figure shows three function graphs, A, B, and C, and three possible derivative graphs, 1, 2, and 3. Match each function graph with its derivative graph. Justify your choices using slope, local extrema, or stationary inflection points.
Figure for problem 533917

Hints

- Match horizontal tangents with zeros of the derivative. - Compare where each function increases or decreases with the sign of its derivative. - A stationary inflection point gives a derivative that touches the \(x\)-axis without changing sign.

Solution

1. Graph A is an upward-opening parabola with vertex at the origin. Its derivative is an increasing line through the origin, so A matches 3. 2. Graph B is a downward-opening parabola with vertex \((0, 3)\). Its derivative is a decreasing line through the origin, so B matches 2. 3. Graph C is cubic with a stationary inflection point at the origin. Its derivative is nonnegative and equals \(0\) at the origin, so it is an upward-opening parabola with vertex at the origin. Thus, C matches 1.

Answer

A \(\rightarrow\) 3; B \(\rightarrow\) 2; C \(\rightarrow\) 1.
Functions and their derivative graphs 43
Which derivative graph, 1, 2, or 3, matches each function graph, A, B, or C? Justify your matches using local extrema and intervals of increase and decrease.
Figure for problem 533918

Hints

- Match local extrema with zeros of the derivative. - Compare where each function increases or decreases with the sign of the derivative. - Recall the derivative of \(\sin x\).

Solution

1. Graph A is a parabola with a minimum at \(x=2\). Its derivative must change from negative to positive at \(x=2\), so A matches graph 1. 2. Graph B is \(\sin x\). Its derivative is \(\cos x\), whose graph is 2. 3. Graph C has a local minimum at \(x=-1\) and a local maximum at \(x=1\). It increases between those values and decreases outside them. Its derivative must be positive on \((-1,1)\), negative outside, and zero at \(x=\pm1\). Thus, C matches graph 3.

Answer

A \(\rightarrow\) 1; B \(\rightarrow\) 2; C \(\rightarrow\) 3.
Functions and their derivative graphs 44
The graph shown is the derivative \(g'\) of a function \(g\). a) Find the x-coordinates of the inflection points of \(g\). Briefly explain your method. b) At \(x=2\), does \(g\) have a local extremum or a stationary inflection point? Justify your answer using the graph of \(g'\).
Figure for problem 533975

Hints

- Local extrema of \(g'\) correspond to inflection points of \(g\). - A zero of \(g'\) without a sign change does not produce a local extremum of \(g\). - Does \(g'\) change sign at \(x=2\)? - What combines a change in concavity with a horizontal tangent?

Solution

1. Inflection points of \(g\) occur where the graph of \(g'\) has local extrema. 2. The graph of \(g'\) has a local maximum at \(x=0\) and a local minimum at \(x=2\). Therefore, \(g\) has inflection points at \(x=0\) and \(x=2\). 3. At \(x=2\), \(g'(2)=0\), but \(g'\) only touches the x-axis and does not change sign. Thus \(g\) has no local extremum there. Because \(g\) changes concavity and has a horizontal tangent, it has a stationary inflection point at \(x=2\).

Answer

a) \(x=0\) and \(x=2\) b) A stationary inflection point occurs at \(x=2\).
Functions and their derivative graphs 45
The graph shown is the first derivative \(f'\) of a function \(f\). Find the x-coordinates of the inflection points of \(f\). Then determine the intervals in the displayed window where \(f\) is concave up and concave down. Justify your answers using the graph of \(f'\).
Figure for problem 534010

Hints

- Local extrema of \(f'\) correspond to inflection points of \(f\). - Increasing \(f'\) means \(f\) is concave up. - Decreasing \(f'\) means \(f\) is concave down.

Solution

1. The graph of \(f'\) has local extrema at \(x=-2\) and \(x=2\). Therefore, \(f\) has inflection points at those x-values. 2. The displayed x-range is \([-4, 5]\). The graph of \(f'\) is increasing on \([-4, -2)\) and \((2, 5]\), so \(f\) is concave up there. 3. The graph of \(f'\) is decreasing on \((-2, 2)\), so \(f\) is concave down there.

Answer

Inflection-point x-coordinates: \(x=-2\) and \(x=2\). Concave up on \([-4,-2)\) and \((2,5]\); concave down on \((-2,2)\).
Functions and their derivative graphs 46
Graph A shows a function \(f\). Decide whether graph 1 or graph 2 represents \(f^{\prime}\). Justify your choice using features such as zeros and local extrema.
Figure for problem 534199

Hints

- Determine where the original function is increasing and decreasing. - The derivative is zero where the original graph has a horizontal tangent line. - Check the sign of each candidate on both sides of the zero.

Solution

1. The graph of \(f\) is an upward-opening parabola with a local minimum at \(x=0\). 2. Therefore, \(f^{\prime}(0)=0\). Both candidate graphs have a zero at \(x=0\). 3. For \(x<0\), the graph of \(f\) is decreasing, so \(f^{\prime}(x)<0\). For \(x>0\), it is increasing, so \(f^{\prime}(x)>0\). 4. Graph 1 has this sign pattern, while graph 2 has the opposite sign pattern. Therefore, graph 1 represents \(f^{\prime}\).

Answer

Graph 1 represents \(f^{\prime}\).
Functions and their derivative graphs 47
The figure shows two functions, \(f\) and \(g\). Explain mathematically why neither \(g\) can be the derivative of \(f\) nor \(f\) can be the derivative of \(g\). Use features such as zeros, local extrema, or monotonicity.
Figure for problem 534201

Hints

- What must a derivative equal at a smooth local extremum? - What type of function is the derivative of a line? - Compare the zeros of one graph with the horizontal tangents of the other.

Solution

1. The graph of \(f\) has a local minimum at \(x = 2\). If \(g = f'\), then \(g(2)\) would have to be \(0\). Instead, the graph shows \(g(2) > 0\), so \(g\) is not the derivative of \(f\). 2. The graph of \(g\) is a line with constant slope \(-0.5\). Therefore, its derivative is the constant function \(-0.5\). Since \(f\) is a parabola, \(f\) cannot be the derivative of \(g\).

Answer

\(g\) is not the derivative of \(f\) because \(f\) has a local minimum at \(x = 2\), but \(g(2) > 0\). \(f\) is not the derivative of \(g\) because the derivative of the line \(g\) must be a constant function, not a parabola.
Functions and their derivative graphs 48
The graph of \(f\) is shown. Estimate the slope at \(x=0\). Then describe the graph of \(f^{\prime}\) and the relationship between the vertex of \(f\) and the graph of \(f^{\prime}\).
Figure for problem 534212

Hints

- The tangent line at the highest point of a smooth parabola is horizontal. - Use symmetry to compare slopes at opposite inputs. - The derivative of a quadratic function is linear.

Solution

1. At \(x=0\), the graph has its maximum and the tangent line is horizontal. Therefore, \(f^{\prime}(0)=0\). 2. Because \(f\) is a downward-opening parabola, its tangent slopes decrease steadily as \(x\) increases. By symmetry, the slopes are positive to the left of the vertex and negative to the right. 3. Therefore, the graph of \(f^{\prime}\) is a decreasing line through \((0,0)\). Its vertical scale can be estimated from the slopes of \(f\). 4. The x-coordinate of the vertex of \(f\) is the zero of \(f^{\prime}\).

Answer

The slope at \(x=0\) is \(0\). The derivative graph is a decreasing line through \((0,0)\). The vertex of \(f\) occurs at the same input as the zero of \(f^{\prime}\).
Functions and their derivative graphs 49
The graph of a quartic polynomial \(f\) is shown. Decide whether each statement is true or false. (1) The graph is symmetric about the y-axis. (2) The derivative \(f'\) has a zero at \(x=0\). (3) For \(2<x\le3.5\), the graph has positive slope. (4) The function has exactly four zeros on \([-3, 3]\).
Figure for problem 534228

Hints

- Check for a vertical line of symmetry. - A local maximum or minimum has a horizontal tangent. - Determine whether the graph rises or falls on the stated interval. - Count all x-intercepts, including points where the graph only touches the axis.

Solution

1. The graph is symmetric about the y-axis, so (1) is true. 2. The graph has a local minimum at \(x=0\), so \(f'(0)=0\). Thus, (2) is true. 3. On \(2<x\le3.5\), the graph is decreasing, so its slope is negative. Thus, (3) is false. 4. The graph has four x-intercepts on \([-3, 3]\), so (4) is true.

Answer

(1) True (2) True (3) False (4) True
Functions and their derivative graphs 50
The graph shown is the graph of \(f'\), the derivative of a function \(f\). a) Find the \(x\)-coordinates of the local extrema of \(f\). Classify each as a local maximum or local minimum. b) On what interval in the displayed domain is the graph of \(f\) concave up? Justify your answer using the graph of \(f'\).
Figure for problem 534263

Hints

- Find where \(f'\) crosses the \(x\)-axis, and check the sign change at each crossing. - The graph of \(f\) is concave up where the graph of \(f'\) is increasing.

Solution

1. The zeros of \(f'\) are \(x=1\) and \(x=3\). At \(x=1\), \(f'\) changes from negative to positive, so \(f\) has a local minimum. At \(x=3\), \(f'\) changes from positive to negative, so \(f\) has a local maximum. 2. The graph of \(f\) is concave up where \(f'\) is increasing. In the displayed domain, \(f'\) increases for \(-0.5 < x < 2\). Therefore, \(f\) is concave up on \((-0.5, 2)\). At \(x=2\), \(f'\) changes from increasing to decreasing, so \(f\) has an inflection point there.

Answer

a) Local minimum at \(x=1\); local maximum at \(x=3\). b) In the displayed domain, \(f\) is concave up on \((-0.5, 2)\) because \(f'\) is increasing there.
Functions and their derivative graphs 51
The graph shown is the second derivative \(f''\) of a polynomial function \(f\). Find the x-coordinates of all inflection points of \(f\), and state the intervals in the displayed window where \(f\) is concave down.
Figure for problem 534277

Hints

- What does the sign of the second derivative tell you about concavity? - Look for zeros of \(f''\) where the graph crosses the x-axis. - Concave-down intervals occur where \(f''\) is negative.

Solution

1. Inflection points occur where \(f''\) is zero and changes sign. The graph crosses the x-axis at \(x=-4\), \(x=0\), and \(x=4\), so these are the x-coordinates of the inflection points. 2. On the displayed interval \([-6,6]\), \(f''(x)<0\) on \([-6,-4)\) and \((0,4)\). Therefore, \(f\) is concave down on those intervals.

Answer

Inflection-point x-coordinates: \(x=-4\), \(x=0\), and \(x=4\). Concave down on \([-6,-4)\) and \((0,4)\).
Functions and their derivative graphs 52
The graph of \(f\) has marked points \(A\), \(B\), and \(C\). For each point, determine whether \(f(x)\), \(f^{\prime}(x)\), and \(f^{\prime\prime}(x)\) are positive, negative, or zero. Complete the table with \(+\), \(-\), or \(0\). <table> <tr><th>Point</th><th>\(f(x)\)</th><th>\(f^{\prime}(x)\)</th><th>\(f^{\prime\prime}(x)\)</th></tr> <tr><td>\(A\)</td><td>\(\square\)</td><td>\(\square\)</td><td>\(\square\)</td></tr> <tr><td>\(B\)</td><td>\(\square\)</td><td>\(\square\)</td><td>\(\square\)</td></tr> <tr><td>\(C\)</td><td>\(\square\)</td><td>\(\square\)</td><td>\(\square\)</td></tr> </table>
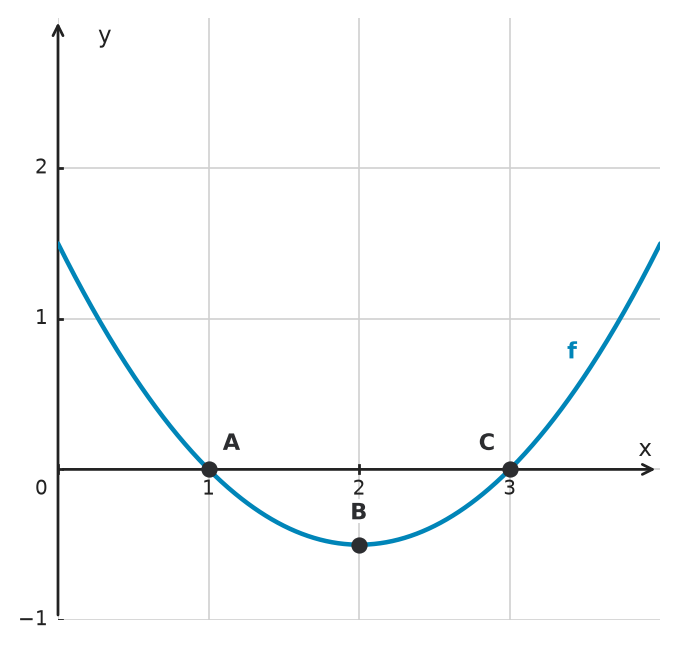
Figure for problem 534294

Hints

- Use vertical position to determine the sign of the function value. - Use increasing, decreasing, or horizontal behavior to determine the sign of the first derivative. - Use concavity to determine the sign of the second derivative. - Examine the tangent line at each marked point.

Solution

1. At \(A(1,0)\), the point lies on the x-axis, so \(f(1)=0\). The graph is decreasing, so \(f^{\prime}(1)<0\). The graph is concave up, so \(f^{\prime\prime}(1)>0\). 2. At \(B(2,-0.5)\), the point lies below the x-axis, so \(f(2)<0\). The tangent line is horizontal at the vertex, so \(f^{\prime}(2)=0\). The graph is concave up, so \(f^{\prime\prime}(2)>0\). 3. At \(C(3,0)\), the point lies on the x-axis, so \(f(3)=0\). The graph is increasing, so \(f^{\prime}(3)>0\). The graph is concave up, so \(f^{\prime\prime}(3)>0\).

Answer

The completed table is: <table> <tr><th>Point</th><th>\(f(x)\)</th><th>\(f^{\prime}(x)\)</th><th>\(f^{\prime\prime}(x)\)</th></tr> <tr><td>\(A\)</td><td>\(0\)</td><td>\(-\)</td><td>\(+\)</td></tr> <tr><td>\(B\)</td><td>\(-\)</td><td>\(0\)</td><td>\(+\)</td></tr> <tr><td>\(C\)</td><td>\(0\)</td><td>\(+\)</td><td>\(+\)</td></tr> </table>

Functions and their derivative graphs 53
Match each description to point A, B, or C on the graph. Explain your choice using the signs of \(f'\) and \(f''\). a) The graph is increasing and concave down. b) The graph has a horizontal tangent line. c) The graph is decreasing and concave down.
Figure for problem 534295

Hints

- An increasing graph has a positive first derivative. - A decreasing graph has a negative first derivative. - Concave down means the second derivative is negative. - Locate the point with a horizontal tangent line.

Solution

1. At A the graph is increasing, so \(f'>0\), and is concave down, so \(f''<0\). Thus A matches a). 2. At B the graph has a local maximum: \(f'=0\) and \(f''<0\). Thus B matches b). 3. At C the graph is decreasing, so \(f'<0\), and is concave down, so \(f''<0\). Thus C matches c).

Answer

a) A b) B c) C
Functions and their derivative graphs 54
Points \(A\), \(B\), and \(C\) are marked on the graph of \(f\). At each point, state whether the first derivative and second derivative are positive, negative, or zero. Then classify the point as a local extremum or an inflection point.
Figure for problem 534296

Hints

- A horizontal tangent means the first derivative is zero. - Determine whether the graph is increasing or decreasing at each point. - Concave down means the second derivative is negative; concave up means it is positive. - At an inflection point, concavity changes.

Solution

1. At \(A\), the graph has a horizontal tangent and is concave down. Thus, \(f'=0\) and \(f''<0\), so \(A\) is a local maximum. 2. At \(B\), the graph is decreasing and changes from concave down to concave up. Thus, \(f'<0\) and \(f''=0\), so \(B\) is an inflection point. 3. At \(C\), the graph has a horizontal tangent and is concave up. Thus, \(f'=0\) and \(f''>0\), so \(C\) is a local minimum.

Answer

\(A\): \(f'=0\), \(f''<0\); local maximum \(B\): \(f'<0\), \(f''=0\); inflection point \(C\): \(f'=0\), \(f''>0\); local minimum
Functions and their derivative graphs 55
Points \(A\), \(B\), and \(C\) are marked on the graph of the periodic function \(f\). At each point, determine the signs of \(f\), \(f'\), and \(f''\). Then identify which point is a local extremum and which points are inflection points.
Figure for problem 534298

Hints

- Use each point's vertical position to determine the sign of \(f\). - Use whether the graph rises or falls to determine the sign of \(f'\). - A horizontal tangent means \(f'=0\). - A change in concavity indicates an inflection point.

Solution

1. Point \(A\) is at \(x=\frac{\pi}{2}\). Here, \(f<0\), the graph is decreasing so \(f'<0\), and concavity changes, so \(f''=0\). Thus, \(A\) is an inflection point. 2. Point \(B\) is at \(x=\pi\). Here, \(f<0\), the tangent is horizontal so \(f'=0\), and the graph is concave up so \(f''>0\). Thus, \(B\) is a local minimum. 3. Point \(C\) is at \(x=\frac{3\pi}{2}\). Here, \(f<0\), the graph is increasing so \(f'>0\), and concavity changes, so \(f''=0\). Thus, \(C\) is an inflection point.

Answer

\(A\): \(f<0\), \(f'<0\), \(f''=0\); inflection point \(B\): \(f<0\), \(f'=0\), \(f''>0\); local minimum \(C\): \(f<0\), \(f'>0\), \(f''=0\); inflection point
Functions and their derivative graphs 56
The graph of \(f\) has three marked points. Determine the signs of \(f(x)\), \(f'(x)\), and \(f''(x)\) at \(A\), \(B\), and \(C\). What special name is given to point \(B\)? Explain using your results for \(f'(x)\) and \(f''(x)\).
Figure for problem 534299

Hints

- Use the point’s position relative to the x-axis for the sign of \(f(x)\). - Use the tangent slope for the sign of \(f'(x)\). - Look for a change in concavity at \(B\).

Solution

1. At \(A\), the graph is on the x-axis, increasing, and concave down. Therefore, \(f(x)=0\), \(f'(x)>0\), and \(f''(x)<0\). 2. At \(B\), the graph is above the x-axis and has a horizontal tangent. It also changes concavity there. Therefore, \(f(x)>0\), \(f'(x)=0\), and \(f''(x)=0\). A point that is both an inflection point and has a horizontal tangent is a stationary inflection point. 3. At \(C\), the graph is above the x-axis, increasing, and concave up. Therefore, \(f(x)>0\), \(f'(x)>0\), and \(f''(x)>0\).

Answer

Point \(A\): \(f(x)=0\), \(f'(x)>0\), \(f''(x)<0\) Point \(B\): \(f(x)>0\), \(f'(x)=0\), \(f''(x)=0\); \(B\) is a stationary inflection point. Point \(C\): \(f(x)>0\), \(f'(x)>0\), \(f''(x)>0\)
Functions and their derivative graphs 57
The graph shown is the second derivative \(f''\) of a polynomial function \(f\). Determine whether each statement is true or false, and justify your answer. a) The graph of \(f\) is concave up for \(1<x<3\). b) The function \(f\) has an inflection point at \(x=2\). c) The first derivative \(f'\) is strictly increasing on \([0, 2]\). d) The graph of \(f\) has an inflection point at \(x=3\).
Figure for problem 534301

Hints

- Confirm that the displayed graph represents \(f''\), not \(f\) or \(f'\). - Use the sign of \(f''\) to determine concavity. - An inflection point requires a sign change in \(f''\). - Use \(f''\) as the derivative of \(f'\) to analyze the monotonicity of \(f'\).

Solution

1. Statement a is true. On \((1,3)\), \(f''(x)>0\), so \(f\) is concave up. 2. Statement b is false. The graph shows \(f''(2)=1\ne0\), so \(x=2\) is not the x-coordinate of an inflection point. 3. Statement c is false. The derivative of \(f'\) is \(f''\). On \([0,2]\), \(f''\) is negative for \(0\le x<1\) and positive for \(1<x\le2\), so \(f'\) is not increasing throughout the interval. 4. Statement d is true. At \(x=3\), \(f''\) changes from positive to negative, so \(f\) changes concavity.

Answer

a) True b) False c) False d) True
Functions and their derivative graphs 58
The graph of a periodic function \(f\) has marked points \(A\) and \(B\). At each point, determine the sign of \(f^{\prime}(x)\) and the sign of \(f^{\prime\prime}(x)\).
Figure for problem 534304

Hints

- Use increasing or decreasing behavior to determine the sign of the first derivative. - Use concavity to determine the sign of the second derivative.

Solution

1. At point \(A\), the graph is increasing, so \(f^{\prime}(x)>0\). The graph is concave down, so \(f^{\prime\prime}(x)<0\). 2. At point \(B\), the graph is decreasing, so \(f^{\prime}(x)<0\). The graph is concave up, so \(f^{\prime\prime}(x)>0\).

Answer

Point \(A\): \(f^{\prime}(x)>0\) and \(f^{\prime\prime}(x)<0\) Point \(B\): \(f^{\prime}(x)<0\) and \(f^{\prime\prime}(x)>0\)
Functions and their derivative graphs 59
The graph shows \(f\) on \([-3, 3]\). a) Estimate every \(x\)-value where \(f'(x)=0\). b) Determine the sign of \(f''(0)\).
Figure for problem 534305

Hints

- Look for points with horizontal tangents. - Inspect the graph's concavity near \(x=0\).

Solution

1. Horizontal tangents occur at the visible local extrema. From the graph, they occur at approximately \(x=-2.2\), \(x=0\), and \(x=2.2\). 2. Near \(x=0\), the graph is concave down. Therefore, \(f''(0)<0\).

Answer

a) \(x\approx-2.2\), \(x=0\), and \(x\approx2.2\) b) \(f''(0)<0\)
Functions and their derivative graphs 60
Point \(P\) is marked on the graph of the cubic function \(f\). Determine the value of \(f'(-2)\) and the sign of \(f''(-2)\).
Figure for problem 534306

Hints

- A smooth local extremum has a horizontal tangent. - Inspect the graph's concavity at \(P\) to determine the sign of the second derivative.

Solution

1. The marked point \(P\) at \(x=-2\) is a local maximum, so the tangent is horizontal. Therefore, \(f'(-2)=0\). 2. The graph is concave down at \(x=-2\), so \(f''(-2)<0\).

Answer

\(f'(-2)=0\) and \(f''(-2)<0\)
Functions and their derivative graphs 61
The graph shown is the second derivative \(f''\) of a polynomial function \(f\) on \(-2\le x\le5\). Determine whether each statement is true or false. a) The graph of \(f\) is concave down for \(-1<x<3\). b) The first derivative \(f'\) is strictly decreasing for \(3<x\le5\). c) The function \(f\) has an inflection point at \(x=1\). d) If \(f'(0)=0\), then \(f\) has a local maximum at \(x=0\).
Figure for problem 534313

Hints

- Use the sign of \(f''\) to determine concavity. - Use \(f''\) as the derivative of \(f'\) to determine whether \(f'\) increases or decreases. - For a polynomial, what must happen to \(f''\) at an inflection point? - Apply the second derivative test in part d.

Solution

1. Statement a is true because \(f''(x)<0\) for \(-1<x<3\). 2. Statement b is false because \(f''(x)>0\) for \(3<x\le5\), so \(f'\) is increasing there. 3. Statement c is false because \(f''(1)\ne0\). 4. Statement d is true. If \(f'(0)=0\) and \(f''(0)<0\), the second derivative test gives a local maximum at \(x=0\).

Answer

a) True b) False c) False d) True
Functions and their derivative graphs 62
A function \(g\), defined for all real numbers, has exactly two inflection points on \([-5, 5]\). Decide which graph—I, II, or III—could represent \(g''\). Justify your choice and briefly explain why the other graphs cannot represent \(g''\).
Figure for problem 534355

Hints

- What must the second derivative do at an inflection point? - Is a zero of the second derivative alone enough to guarantee an inflection point? - Count the zeros with sign changes in each graph. - Distinguish between crossing and merely touching the x-axis.

Solution

1. Inflection points of \(g\) occur where \(g''\) changes sign. 2. In graph III, the curve touches the x-axis at \(x=-3\) and \(x=3\), but it remains negative on both sides of each zero. There are no sign changes, so this graph would produce no inflection points. 3. Graph II crosses the x-axis at \(x=-3\), \(x=0\), and \(x=3\). Each crossing is a sign change, so this graph would produce three inflection points. 4. Graph I crosses the x-axis only at \(x=-3\) and \(x=3\), and it changes sign at both zeros. Therefore, graph I produces exactly two inflection points.

Answer

Graph I. It has exactly two zeros with sign changes, at \(x=-3\) and \(x=3\). Graph II has three such zeros, while graph III has no sign changes at its zeros.
Functions and their derivative graphs 63
The displays show the graphs of two functions, \(f\) and \(g\), and two possible derivative graphs, \(h_1\) and \(h_2\). Match each function with its derivative graph. Justify your choices by comparing critical points, zeros, and intervals where the functions increase or decrease.
Figure for problem 534391

Hints

- Local maxima and minima of a function correspond to zeros of its derivative. - Compare where each function increases or decreases with where each derivative is positive or negative. - Check all zeros of each possible derivative graph. - Verify that the derivative sign agrees with the slope of the function graph.

Solution

1. The graph of \(f\) has two symmetric local minima and a local maximum at \(x=0\). Its derivative must be zero at those three \(x\)-coordinates. Graph \(h_2\) has zeros at the same locations, with signs that match the increasing and decreasing behavior of \(f\). Therefore, \(f\) matches \(h_2\). 2. The graph of \(g\) has two symmetric local maxima and a local minimum at \(x=0\). Graph \(h_1\) has zeros at the same three \(x\)-coordinates, with signs that match the increasing and decreasing behavior of \(g\). Therefore, \(g\) matches \(h_1\).

Answer

\(f\) matches \(h_2\), and \(g\) matches \(h_1\).
Functions and their derivative graphs 64
The graph of \(f'\) is shown. Determine whether each statement about \(f\) is true or false. Give a brief justification. (1) \(f\) is strictly increasing on \([1,4]\). (2) \(f\) has a local maximum at \(x=5\). (3) The graph of \(f\) is concave down on \([0,2]\). (4) The tangent to the graph of \(f\) at \(x=3\) has slope \(2\).
Figure for problem 534416

Hints

- The sign of \(f'\) determines increasing and decreasing behavior. - A sign change of \(f'\) classifies a local extremum. - Whether \(f'\) is increasing or decreasing determines concavity. - The y-value of the derivative graph is the tangent slope of \(f\).

Solution

1. True. The graph shows \(f'>0\) on \((1,4)\), so \(f\) is strictly increasing there. 2. True. At \(x=5\), \(f'\) changes from positive to negative, so \(f\) has a local maximum. 3. False. The derivative graph is increasing on \((0,2)\), so \(f\) is concave up there. 4. True. The tangent slope is \(f'(3)=2\).

Answer

(1) True. (2) True. (3) False. (4) True.
Functions and their derivative graphs 65
Graphs (1) and (2) are shown on \([0,2\pi]\). One graph represents a function \(f\), and the other represents its derivative \(f'\). Determine which graph is which and justify your answer.
Figure for problem 534420

Hints

- Zeros of a derivative correspond to horizontal tangents of the original function. - A positive derivative means the original function is increasing; a negative derivative means it is decreasing. - Compare both relationships at the quarter-period points.

Solution

1. Graph (1) has zeros at \(x=\frac{\pi}{2}\) and \(x=\frac{3\pi}{2}\). Graph (2) has a local maximum and a local minimum at those same x-values, as an original function should when its derivative is zero and changes sign. 2. Graph (1) is positive on \((0,\frac{\pi}{2})\), and graph (2) is increasing there. Graph (1) is negative on \((\frac{\pi}{2},\frac{3\pi}{2})\), and graph (2) is decreasing there. 3. Therefore, graph (1) is \(f'\), and graph (2) is \(f\).

Answer

Graph (1) is \(f'\); graph (2) is \(f\).
Functions and their derivative graphs 66
Graphs (1) and (2) represent a function \(f\) and its derivative \(f'\). Determine which graph represents each. Justify your answer by comparing function values with slopes.
Figure for problem 534421

Hints

- Compare the y-value of one graph with the slope of the other at the same x-value. - Check whether the sign of the candidate derivative matches the direction of change of the candidate original function. - Use more than one point or interval to confirm the match.

Solution

1. If graph (2) is \(f'\), its value at each x-value must equal the slope of graph (1). 2. At \(x=0\), graph (2) has value \(0.5\). Graph (1) has a positive slope of \(0.5\) there. 3. Across the displayed interval, graph (2) stays positive while graph (1) is increasing, and the changing values of graph (2) agree with the changing steepness of graph (1). Therefore, graph (1) is \(f\), and graph (2) is \(f'\).

Answer

Graph (1) is \(f\); graph (2) is \(f'\).
Functions and their derivative graphs 67
The two graphs shown on \(-0.8\le x\le5\) represent a function \(f\) and its derivative \(f'\). Determine which graph represents \(f\) and which represents \(f'\). Justify your answer using increasing/decreasing behavior and concavity.
Figure for problem 534422

Hints

- Compare the sign of one graph with whether the other graph rises or falls. - Compare whether the candidate derivative is increasing or decreasing with the concavity of the other graph. - Check the steepness of graph (2) where graph (1) is large and where it is small.

Solution

1. Graph (1) stays positive throughout the displayed interval, while graph (2) increases. Thus graph (1) could be the derivative of graph (2). 2. Graph (1) decreases as \(x\) increases. Graph (2) is concave down, as expected when its derivative decreases. 3. Therefore, graph (2) is \(f\), and graph (1) is \(f'\).

Answer

Graph (2) is \(f\), and graph (1) is \(f'\).
Functions and their derivative graphs 68
The graph of \(f'\) is shown on \([-4,4]\). a) Determine the open intervals on which \(f\) is increasing and decreasing. b) Find the \(x\)-coordinates of all local extrema of \(f\) and classify each. c) Determine the concavity intervals of \(f\) and the \(x\)-coordinate of its inflection point.
Figure for problem 534433

Hints

- Use where the derivative graph lies above or below the x-axis. - At each zero of the derivative, compare its signs on the two sides. - For concavity, focus on whether the derivative graph is decreasing or increasing.

Solution

1. Here \(f'(x)=x^2-4\). It is positive on \((-4,-2)\) and \((2,4)\), and negative on \((-2,2)\). Thus \(f\) increases on \((-4,-2)\) and \((2,4)\), and decreases on \((-2,2)\). 2. At \(x=-2\), \(f'\) changes from positive to negative, so \(f\) has a local maximum. At \(x=2\), \(f'\) changes from negative to positive, so \(f\) has a local minimum. 3. Since \(f''(x)=2x\), \(f''<0\) for \(x<0\) and \(f''>0\) for \(x>0\). Therefore, \(f\) is concave down on \((-4,0)\), concave up on \((0,4)\), and has an inflection point at \(x=0\).

Answer

a) Increasing on \((-4,-2)\) and \((2,4)\); decreasing on \((-2,2)\) b) Local maximum at \(x=-2\); local minimum at \(x=2\) c) Concave down on \((-4,0)\); concave up on \((0,4)\); inflection point at \(x=0\)
Functions and their derivative graphs 69
The graph of \(h\) has a horizontal inflection point at \(x=1\). Describe the graph of \(h^{\prime}\), and briefly explain its behavior near \(x=1\).
Figure for problem 534506

Hints

- Determine the tangent slope at a horizontal inflection point. - Check whether the original function increases or decreases on each side. - A zero without a sign change appears as a touch rather than a crossing.

Solution

1. At a horizontal inflection point, the tangent line is horizontal, so \(h^{\prime}(1)=0\). 2. The function \(h\) is increasing on both sides of \(x=1\). Therefore, \(h^{\prime}(x)>0\) for \(x\ne1\). 3. The derivative graph touches the x-axis at \(x=1\) without crossing it. Because the original graph has point symmetry about \((1,1)\), the derivative graph is symmetric about the vertical line \(x=1\). 4. Thus, the derivative graph is a smooth curve symmetric about \(x=1\), with a minimum at \((1,0)\) and values above the x-axis elsewhere.

Answer

The derivative graph is symmetric about \(x=1\), touches the x-axis at \((1,0)\), and remains positive on both sides, so the zero has no sign change.
Functions and their derivative graphs 70
Does the graph of \(f(x)=1-e^{-x}\) look steeper at \(x=0\) or at \(x=3\)? Check by finding \(f'(0)\) and \(f'(3)\). Then explain what value \(f'(x)\) approaches as \(x\to\infty\).
Figure for problem 534509

Hints

- Compare the direction of the curve near the two marked x-values. - Use the function formula to calculate the two tangent slopes. - A graph approaching a horizontal line is not, by itself, proof of a derivative limit.

Solution

1. The graph is visibly steeper near \(x=0\) than near \(x=3\). 2. Differentiating gives \(f'(x)=e^{-x}\), so \(f'(0)=1\) and \(f'(3)=e^{-3}<1\), confirming the graph-based comparison. 3. As \(x\to\infty\), \(e^{-x}\to0\), so the derivative approaches \(0\) from above.

Answer

Steeper at \(x=0\): \(f'(0)=1\) and \(f'(3)=e^{-3}\). Also, \(f'(x)=e^{-x}\to0\) as \(x\to\infty\).
Functions and their derivative graphs 71
The graph shows two curves labeled \(p\) and \(q\). One is a function \(f\), and the other is its derivative \(f'\). a) Identify which curve is \(f\) and which is \(f'\). Justify your choice from how the slope of the increasing curve changes as \(x\) increases. b) Find the slope of the tangent to \(f\) at \(x=1\) and at \(x=4\). c) At what x-value do \(f(x)\) and \(f'(x)\) have the same value?
Figure for problem 534581

Hints

- Decide which curve could represent tangent slopes of the other curve. - An increasing function has positive derivative values; if it becomes less steep, those derivative values should decrease. - After identifying \(f'\), read its y-values at the requested inputs.

Solution

1. Curve \(p\) is \(f\), and curve \(q\) is \(f'\). Curve \(p\) is increasing but becomes less steep, so its derivative should stay positive while decreasing; curve \(q\) has exactly that behavior. 2. From curve \(q\), \(f'(1)=0.5\) and \(f'(4)=0.25\). 3. The function and derivative have the same value where curves \(p\) and \(q\) intersect, which occurs at \(x=0.5\).

Answer

a) \(p=f\) and \(q=f'\) b) At \(x=1\), the slope is \(0.5\); at \(x=4\), the slope is \(0.25\). c) \(x=0.5\)
Functions and their derivative graphs 72
The graph of a cubic function \(f\) is shown. a) Find all x-values where \(f'(x)=0\). b) On what open interval is \(f'(x)<0\)? c) On what open interval in the displayed domain is \(f''(x)>0\)? d) Classify the local extrema of \(f\). e) Give the x-coordinate of the inflection point of \(f\).
Figure for problem 534653

Hints

- Horizontal tangents reveal zeros of the first derivative. - Read the sign of \(f'\) from whether the graph rises or falls. - Read the sign of \(f''\) from the graph's concavity. - A change in concavity identifies an inflection point.

Solution

1. Zeros of \(f'\) occur where the graph of \(f\) has horizontal tangents. The graph has horizontal tangents at \(x=-2\) and \(x=2\). 2. The function decreases between those turning points, so \(f'(x)<0\) on \((-2,2)\). 3. The graph is concave up for \(x>0\), so in the displayed domain \(f''(x)>0\) on \((0,5)\). 4. At \(x=-2\), the graph changes from increasing to decreasing, so \(f\) has a local maximum. At \(x=2\), it changes from decreasing to increasing, so \(f\) has a local minimum. 5. The concavity changes at \(x=0\), so \(f\) has an inflection point there.

Answer

a) \(x=-2\) and \(x=2\) b) \((-2,2)\) c) \((0,5)\) d) Local maximum at \(x=-2\); local minimum at \(x=2\) e) Inflection point at \(x=0\)
Functions and their derivative graphs 73
One of the four graphs could represent a function \(f\) whose derivative is \(f'(x)=\cos(x)\) on \([0,2\pi]\). Identify the correct graph and justify your choice using zeros and signs of \(f'\).
Figure for problem 535012

Hints

- Mark where the given derivative is positive, zero, and negative. - Translate those signs into increasing and decreasing behavior of the original function. - Use the derivative's zeros to locate the original function's horizontal tangents.

Solution

1. The derivative is positive on \((0,\frac{\pi}{2})\), zero at \(x=\frac{\pi}{2}\), negative on \((\frac{\pi}{2},\frac{3\pi}{2})\), zero at \(x=\frac{3\pi}{2}\), and positive on \((\frac{3\pi}{2},2\pi)\). 2. Therefore, \(f\) must increase, then have a local maximum at \(x=\frac{\pi}{2}\), decrease to a local minimum at \(x=\frac{3\pi}{2}\), and then increase again. 3. Graph a has exactly this behavior. Thus graph a could represent \(f\).

Answer

Graph a
Functions and their derivative graphs 74
One of the four graphs could represent a function \(f\) whose derivative is \(f'(x)=\frac12x-1\). Identify the correct graph and justify your choice using the zero and sign of \(f'\).
Figure for problem 535013

Hints

- Find where the given derivative is zero. - Use the sign of the derivative on each side of that zero. - Use whether the derivative itself is increasing or decreasing to determine concavity.

Solution

1. The derivative has a zero at \(x=2\). 2. For \(x<2\), \(f'(x)<0\), so \(f\) decreases. For \(x>2\), \(f'(x)>0\), so \(f\) increases. Therefore, \(f\) has a local minimum at \(x=2\). 3. Since \(f'\) is linear with positive slope, \(f\) must be concave up. Only graph a is concave up and has its minimum at \(x=2\).

Answer

Graph a
Functions and their derivative graphs 75
The graph of \(q'\) is shown. Sipho makes two claims: 1. “\(q\) has a local minimum at \(x=-2\) because \(q'(-2)=0\).” 2. “\(q\) is concave up wherever \(q'>0\).” For each claim, decide whether it is correct. If it is incorrect, replace it with a correct conclusion supported by the graph.
Figure for problem 550339

Hints

- A zero of the derivative must be interpreted using the derivative's signs on both sides. - Keep the derivative's sign separate from whether the derivative itself is rising or falling. - Use one feature of the graph for extrema and a different feature for concavity.

Solution

1. Claim 1 is incorrect. At \(x=-2\), \(q'\) changes from positive to negative, so \(q\) has a local maximum, not a local minimum. 2. Claim 2 is incorrect. Concavity is determined by whether \(q'\) is increasing or decreasing, not by the sign of \(q'\). The derivative decreases on \((-5,0)\), so \(q\) is concave down there; it increases on \((0,5)\), so \(q\) is concave up there. Thus \(x=0\) is the x-coordinate of an inflection point.

Answer

1. Incorrect: \(q\) has a local maximum at \(x=-2\). 2. Incorrect: \(q\) is concave down on \((-5,0)\) and concave up on \((0,5)\); \(x=0\) is an inflection-point x-coordinate.
Functions and their derivative graphs 76
Two graphs give \(f'\) and \(f''\) for \(-3<x<3\). Describe a possible graph of \(f\): give the order of increasing and decreasing parts, the local extrema, and where the curve changes concavity. No drawing is needed.
Figure for problem 562374

Hints

- Use the zeros and signs of the first derivative for the rise-fall pattern. - Use the second derivative graph separately to locate changes in bending. - Combine both descriptions into a single graph shape; the actual vertical position is unknown.

Solution

1. The first graph represents \(f'(x)=x^2-4\), with zeros \(-2\) and \(2\). It is positive outside these roots and negative between them. 2. Thus \(f\) increases on \((-3,-2)\), decreases on \((-2,2)\), and increases on \((2,3)\). It has a local maximum at \(-2\) and a local minimum at \(2\). 3. The second graph represents \(f''(x)=2x\), negative to the left of \(0\) and positive to the right. 4. Hence \(f\) is concave down on \((-3,0)\), concave up on \((0,3)\), and changes concavity at \(x=0\).

Answer

Increasing: \((-3,-2)\) and \((2,3)\). Decreasing: \((-2,2)\). Local maximum at \(x=-2\), local minimum at \(x=2\). Concave down for \(x<0\), concave up for \(x>0\), with an inflection point at \(x=0\).
Functions and their derivative graphs 77
A student proposes that the graphs shown could represent \(f'\) and \(f''\) for the same function on \((-2,2)\). Is that possible? Explain the conflict between the graphs.
Figure for problem 562375

Hints

- The second derivative describes how the first derivative changes. - Look at the direction of the first derivative graph on the right of the origin. - Compare that direction with the sign shown by the second derivative graph.

Solution

1. The first graph shows \(f'(x)=x^2+1\), which decreases on \((-2,0)\) and increases on \((0,2)\). 2. The second graph claims \(f''(x)=-2\) everywhere, which would make \(f'\) strictly decreasing throughout the interval. 3. These two properties conflict on \((0,2)\), so the graphs cannot be derivatives of the same function.

Answer

No. The graph of \(f'\) increases on \((0,2)\), but a negative \(f''\) would require \(f'\) to decrease there.
Functions and their derivative graphs 78
The graphs of \(f'\) and \(f''\) are shown for \(-2<x<2\). Describe the shape of \(f\) near \(x=0\). Does \(f\) have a local extremum or a stationary inflection point there?
Figure for problem 562376

Hints

- Does the sign of the first derivative change at the origin? - What happens to the sign of the second derivative there? - Combine movement and bending before naming the point.

Solution

1. The graph of \(f'\) is \(3x^2\). It is positive on each side of \(0\) and zero at \(0\). 2. Thus \(f\) increases on both sides of \(0\) and has a horizontal tangent there, not a local maximum or minimum. 3. The second derivative graph is \(6x\), negative to the left of \(0\) and positive to the right. 4. The graph of \(f\) changes from concave down to concave up at \(0\), so it has a stationary inflection point.

Answer

\(f\) rises through a horizontal tangent at \(x=0\), changing from concave down to concave up. It has a stationary inflection point, not a local extremum.
Functions and their derivative graphs 79
A continuous function \(f\) has \(f'(x)>0\) on \((-3,-1)\), \(f'(x)<0\) on \((-1,1)\), and \(f'(x)>0\) on \((1,3)\). Decide whether each statement must be true: a) \(f(-1)>f(-3)\) b) \(f(-1)>f(1)\) c) \(f(3)>f(1)\) d) \(f(3)>f(-3)\)

Hints

- First identify the direction of the graph on each stated interval. - Compare values at the ends of a single monotone interval. - Could a rise, a fall, and another rise combine to give different overall changes?

Solution

1. On \((-3,-1)\), positive derivative means \(f\) increases; continuity at the ends gives \(f(-1)>f(-3)\). 2. On \((-1,1)\), negative derivative means \(f\) decreases, so \(f(-1)>f(1)\). 3. On \((1,3)\), positive derivative means \(f(3)>f(1)\). 4. The signs alone do not compare \(f(-3)\) and \(f(3)\). The total rise and fall can have different sizes, so part d) need not hold.

Answer

a) Must be true. b) Must be true. c) Must be true. d) Not necessarily true.
Functions and their derivative graphs 80
Given \(f(0)=1\), determine the following without finding a formula for \(f\): a) The x-coordinates of any local maximum and minimum of \(f\). b) The inflection-point x-coordinate. c) Whether \(f(-1)\) is greater or less than \(1\), and whether \(f(1)\) is greater or less than \(1\).
Figure for problem 563039

Hints

- The plotted curve is the derivative, so its height tells you the sign of \(f'\). - Its rise or fall tells you the concavity of \(f\). - Compare the function values by walking along an interval where the function decreases.

Solution

1. The derivative is positive to the left of \(-1\), negative between \(-1\) and \(1\), and positive to the right of \(1\). Thus \(f\) has a local maximum at \(x=-1\) and a local minimum at \(x=1\). 2. The derivative graph decreases up to \(x=0\) and increases afterward, so concavity changes at \(x=0\). 3. Since \(f\) decreases from \(-1\) to \(0\), \(f(-1)>f(0)=1\). Since it also decreases from \(0\) to \(1\), \(f(1)<1\).

Answer

a) Local maximum at \(x=-1\); local minimum at \(x=1\). b) Inflection-point x-coordinate \(0\). c) \(f(-1)>1\) and \(f(1)<1\).
Functions and their derivative graphs 81
Let \(f(x)=\frac{(3x-2)^2}{2x}\). a) Find an equation of the tangent line at \(P=(1,0.5)\). b) Find the vertical asymptote of \(f'\). Does \(f'\) change sign across it, close to the asymptote?

Hints

- Would an algebraically equivalent form of \(f\) make differentiation easier? - What information about the curve at \(P\) determines its tangent line? - Can the derivative have the same sign on both sides of a vertical asymptote?

Solution

1. Rewrite \(f(x)=\frac{9x^2-12x+4}{2x}=4.5x-6+\frac{2}{x}\), for \(x\ne0\). 2. Differentiate: \(f'(x)=4.5-\frac{2}{x^2}=\frac{9x^2-4}{2x^2}\). 3. At \(x=1\), the slope is \(f'(1)=2.5\). Through \(P\), the tangent is \(y-0.5=2.5(x-1)\), or \(y=2.5x-2\). 4. The derivative has a vertical asymptote at \(x=0\), since \(9x^2-4\) approaches \(-4\) and \(2x^2\) approaches \(0\). 5. Close to \(0\) on either side, \(9x^2-4<0\) and \(2x^2>0\). Therefore, \(f'(x)<0\) on both sides; there is no sign change near the asymptote.

Answer

a) \(y=2.5x-2\) b) The vertical asymptote is \(x=0\). The derivative is negative on both sides close to \(0\), so its sign does not change there.
Functions and their derivative graphs 82
The left coordinate plane shows the graph of a function \(f\). The right coordinate plane shows three possible derivative graphs: \(A\) in blue, \(B\) in red, and \(C\) in green. Which graph represents \(f'\)? Justify your choice using the behavior of \(f\).
Figure for problem 532171

Hints

- Locate the local maximum and minimum of \(f\). - What is the derivative value at a smooth extremum? - Determine where \(f\) is increasing and decreasing. - Match those intervals to the sign of each candidate graph.

Solution

1. The graph of \(f\) has a local maximum at \(x=-1\) and a local minimum at \(x=1\). Therefore, \(f'(-1)=0\) and \(f'(1)=0\). This eliminates graph \(C\), which has only one zero. 2. The function increases for \(x<-1\) and \(x>1\), so \(f'(x)>0\) there. It decreases for \(-1<x<1\), so \(f'(x)<0\) there. 3. Only graph \(A\) has zeros at \(-1\) and \(1\), is negative between them, and is positive outside them. Therefore, graph \(A\) represents \(f'\).

Answer

Graph \(A\) represents \(f'\).
Functions and their derivative graphs 83
The graph of \(f\) is shown. Decide whether each statement about \(f'\) is true or false. Justify your decisions. 1) The graph of \(f'\) lies entirely below the x-axis on \([-1,1]\). 2) \(f'(-2)=0\). 3) The graph of \(f'\) has a local maximum at \(x=0\). 4) \(f'(3)<0\).
Figure for problem 532356

Hints

- Identify where \(f\) is increasing and decreasing. - Relate the sign of \(f'\) to the direction of change of \(f\). - At a smooth extremum, the tangent slope is zero. - Where does \(f\) have its most negative slope?

Solution

1. Statement 1 is true. The function \(f\) is decreasing throughout \([-1,1]\), so \(f'(x)<0\) there. 2. Statement 2 is true. The graph of \(f\) has a local maximum at \(x=-2\), so its tangent is horizontal and \(f'(-2)=0\). 3. Statement 3 is false. At \(x=0\), the graph of \(f\) has its steepest negative slope. Therefore, \(f'\) has a local minimum there, not a local maximum. 4. Statement 4 is false. To the right of the local minimum at \(x=2\), the graph of \(f\) is increasing, so \(f'(3)>0\).

Answer

1) True 2) True 3) False 4) False
Functions and their derivative graphs 84
The graph of \(f\) and the tangent line \(t\) at the inflection point \(W(0,0)\) are shown. a) Find all inputs where \(f'(x)=0\). b) Use the slope of \(t\) to find \(f'(0)\). c) Give the largest interval on which \(f\) is strictly decreasing.
Figure for problem 532359

Hints

- The derivative gives the tangent slope at each input. - At a smooth local maximum or minimum, the tangent is horizontal. - Use a slope triangle on the red tangent line. - Identify the interval where the graph moves downward from left to right.

Solution

1. The graph has a local maximum at \(x=-2\) and a local minimum at \(x=2\). The tangents are horizontal there, so \(f'(-2)=0\) and \(f'(2)=0\). 2. The tangent \(t\) passes through \((0,0)\) and \((1,-3)\). Its slope is \(\frac{-3-0}{1-0}=-3\), so \(f'(0)=-3\). 3. The graph decreases from the local maximum to the local minimum. Thus, the largest interval is \([-2,2]\).

Answer

a) \(x=-2\) and \(x=2\) b) \(f'(0)=-3\) c) \([-2,2]\)
Functions and their derivative graphs 85
The graph shown is the graph of the first derivative \(f'\) of a function \(f\). Determine whether each statement is true or false. Justify your answer. a) The function \(f\) is strictly increasing on \(-1<x<1\). b) The function \(f\) has a local maximum at \(x=3\). c) The graph of \(f\) is concave down on \(0<x<2\).
Figure for problem 532372

Hints

- What does the sign of \(f'\) tell you about whether \(f\) is increasing or decreasing? - What sign change of \(f'\) indicates a local maximum or minimum of \(f\)? - How does the slope of the graph of \(f'\) relate to \(f''\)?

Solution

1. Statement a is true. On \(-1<x<1\), the graph of \(f'\) is above the x-axis, so \(f'(x)>0\). Therefore, \(f\) is strictly increasing there. 2. Statement b is false. At \(x=3\), \(f'\) changes from negative to positive. Therefore, \(f\) has a local minimum, not a local maximum. 3. Statement c is true. On \(0<x<2\), the graph of \(f'\) is decreasing. Therefore, \(f''(x)<0\), so \(f\) is concave down there.

Answer

a) True; \(f'(x)>0\) on \(-1<x<1\). b) False; \(f'\) changes from negative to positive at \(x=3\), so \(f\) has a local minimum. c) True; \(f'\) is decreasing on \(0<x<2\), so \(f''(x)<0\).
Functions and their derivative graphs 86
The two graphs represent \(f'\) and \(f''\) for the same function \(f\). a) Explain which graph is \(f'\) and which is \(f''\). b) Find and classify the local extrema of \(f\) using the second derivative test.
Figure for problem 532382

Hints

- Compare the turning point of one graph with the zero of the other. - Local extrema of \(f\) can occur where \(f'(x)=0\). - Use the sign of \(f''\) at each critical number to apply the second derivative test.

Solution

1. The parabola \(g\) has its minimum at \(x=1\), and line \(h\) is zero there. The signs of \(h\) agree with when \(g\) decreases and increases. Therefore, \(g=f'\) and \(h=f''\). 2. The zeros of \(g=f'\) are \(x=-1\) and \(x=3\). 3. Since \(f''(-1)=-4<0\), \(f\) has a local maximum at \(x=-1\). Since \(f''(3)=4>0\), \(f\) has a local minimum at \(x=3\).

Answer

a) \(g=f'\), and \(h=f''\). b) Local maximum at \(x=-1\); local minimum at \(x=3\).
Functions and their derivative graphs 87
The graph shows the derivative \(f'\) of a polynomial function \(f\). Determine whether each statement is true or false. Justify your answer. a) The function \(f\) has exactly three local extrema in \((-2.5, 3.5)\). b) The function \(f\) is strictly decreasing on \([0.5, 2.5]\). c) The graph of \(f\) has an inflection point at \(x = 0\).
Figure for problem 532384

Hints

- Relate zeros and sign changes of \(f'\) to local extrema of \(f\). - Use the sign of \(f'\) to determine where \(f\) increases or decreases. - Inflection points of \(f\) correspond to local extrema of \(f'\), not merely zeros of \(f'\).

Solution

1. The graph of \(f'\) crosses the \(x\)-axis at \(x = -2\), \(x = 0\), and \(x = 3\). Each zero has a sign change, so \(f\) has exactly three local extrema in \((-2.5, 3.5)\). Statement a) is true. 2. The graph of \(f'\) is below the \(x\)-axis throughout \([0.5, 2.5]\), so \(f'(x) < 0\) there and \(f\) is strictly decreasing. Statement b) is true. 3. An inflection point of \(f\) occurs where \(f'\) has a local extremum, because that is where \(f''\) changes sign. At \(x = 0\), \(f'\) crosses the axis but does not have a local extremum. Statement c) is false.

Answer

a) True b) True c) False
Functions and their derivative graphs 88
The graph of \(f'\) is shown. a) Find the x-coordinates of all local extrema of \(f\). Classify each and justify your answer. b) Find the x-coordinate of the inflection point of \(f\) and justify your answer from the derivative graph.
Figure for problem 532417

Hints

- Use zeros and sign changes of the derivative for local extrema. - For concavity, track whether the derivative graph is increasing or decreasing. - A turning point of \(f'\) corresponds to a concavity change of \(f\) when that direction changes.

Solution

1. Local extrema of \(f\) occur at zeros of \(f'\) where the sign changes. 2. At \(x=-1\), \(f'\) changes from positive to negative, so \(f\) has a local maximum. 3. At \(x=3\), \(f'\) changes from negative to positive, so \(f\) has a local minimum. 4. The derivative graph has a local minimum at \(x=1\), changing from decreasing to increasing. Thus \(f\) changes from concave down to concave up there, so \(x=1\) is an inflection point.

Answer

a) Local maximum at \(x=-1\); local minimum at \(x=3\). b) Inflection point at \(x=1\).
Functions and their derivative graphs 89
The figure shows two graphs labeled \(g_1\) and \(g_2\). One graph represents a function \(f\), and the other represents its derivative \(f'\). a) Decide which graph represents \(f\) and which represents \(f'\). Justify your answer using critical numbers or increasing and decreasing behavior. b) Estimate the coordinates of the local maximum, local minimum, and inflection point of \(f\). c) Find the interval on which \(f\) is strictly decreasing.
Figure for problem 532436

Hints

- Compare the zeros of one graph with the horizontal tangents of the other. - A function decreases where its derivative is negative. - An inflection point of \(f\) corresponds to a local extremum of \(f'\). - Read the requested coordinates from the graph of \(f\).

Solution

1. The graph labeled \(g_1\) has horizontal tangents at \(x=-2\) and \(x=2\), while the graph labeled \(g_2\) is zero at those values. Also, \(g_1\) decreases between \(-2\) and \(2\), where \(g_2\) is negative. Therefore, \(g_1\) represents \(f\) and \(g_2\) represents \(f'\). 2. Reading from \(g_1\), the local maximum is \((-2, 3)\), the local minimum is \((2, -1)\), and the inflection point is \((0, 1)\). 3. Since \(g_2\) is negative for \(-2<x<2\), \(f\) is strictly decreasing on \([-2, 2]\).

Answer

a) \(g_1\) represents \(f\), and \(g_2\) represents \(f'\). b) Local maximum: \((-2, 3)\); local minimum: \((2, -1)\); inflection point: \((0, 1)\) c) \([-2, 2]\)
Functions and their derivative graphs 90
The graph shows the derivative \(f'\) of a function \(f\) on \([-4, 4]\). a) On which intervals is \(f\) strictly increasing, and on which intervals is it strictly decreasing? b) At which \(x\)-values does \(f\) have local extrema? Classify each as a local maximum or local minimum. c) Explain why \(f\) has an inflection point at \(x = 0\).
Figure for problem 532440

Hints

- Use the sign of \(f'\) to determine where \(f\) increases or decreases. - Check the direction of each sign change at a zero of \(f'\). - A local extremum of \(f'\) indicates a possible inflection point of \(f\).

Solution

1. The derivative is positive on \((-4, -2)\) and \((2, 4)\), so \(f\) is strictly increasing on \([-4, -2]\) and \([2, 4]\). The derivative is negative on \((-2, 2)\), so \(f\) is strictly decreasing on \([-2, 2]\). 2. At \(x = -2\), \(f'\) changes from positive to negative, so \(f\) has a local maximum. At \(x = 2\), \(f'\) changes from negative to positive, so \(f\) has a local minimum. 3. The graph of \(f'\) has a local minimum at \(x = 0\), so \(f''\) changes sign there. Therefore, the concavity of \(f\) changes at \(x = 0\), giving an inflection point.

Answer

a) Increasing on \([-4, -2]\) and \([2, 4]\); decreasing on \([-2, 2]\) b) Local maximum at \(x = -2\); local minimum at \(x = 2\) c) \(f'\) has a local minimum at \(x = 0\), so \(f\) changes concavity there.
Functions and their derivative graphs 91
The graph shows the first derivative \(f'\) of a polynomial function \(f\) on \([-5, 5]\). a) Find the intervals on which \(f\) is strictly increasing and strictly decreasing. b) Find the \(x\)-coordinates of all local maxima and local minima of \(f\). Briefly justify your answer using the graph of \(f'\). c) Estimate the \(x\)-coordinates of all inflection points of \(f\) to the nearest tenth. Then describe where \(f\) is concave up and concave down using those estimates.
Figure for problem 532441

Hints

- Use the sign of \(f'\) for increasing and decreasing intervals. - Use sign changes of \(f'\) to classify local extrema. - Inflection points of \(f\) occur where \(f'\) changes from increasing to decreasing or vice versa. - The graph of \(f\) is concave up where \(f'\) is increasing and concave down where \(f'\) is decreasing.

Solution

1. The derivative is positive on \((-5, -4)\) and \((-1, 4)\), so \(f\) is strictly increasing on \([-5, -4]\) and \([-1, 4]\). It is negative on \((-4, -1)\) and \((4, 5)\), so \(f\) is strictly decreasing on \([-4, -1]\) and \([4, 5]\). 2. At \(x = -4\), \(f'\) changes from positive to negative, giving a local maximum. At \(x = -1\), it changes from negative to positive, giving a local minimum. At \(x = 4\), it changes from positive to negative, giving another local maximum. 3. Inflection points of \(f\) occur where \(f'\) has local extrema. From the graph, these occur at about \(x \approx -2.7\) and \(x = 2\). Using these estimates, \(f'\) increases approximately on \((-2.7, 2)\), so \(f\) is concave up there. It decreases approximately on \((-5, -2.7)\) and \((2, 5)\), so \(f\) is concave down there.

Answer

a) Increasing on \([-5, -4]\) and \([-1, 4]\); decreasing on \([-4, -1]\) and \([4, 5]\) b) Local maxima at \(x = -4\) and \(x = 4\); local minimum at \(x = -1\) c) Inflection points at approximately \(x \approx -2.7\) and \(x = 2\); concave up approximately on \((-2.7, 2)\); concave down approximately on \((-5, -2.7)\) and \((2, 5)\)
Functions and their derivative graphs 92
Panels A, B, and C show three function graphs. Panels (1), (2), and (3) show their derivative graphs in a different order. Match each function graph, A, B, and C, with the correct derivative graph, (1), (2), or (3). Justify your matches using zeros, local maxima and minima, and increasing and decreasing behavior.
Figure for problem 532523

Hints

- Match horizontal tangents of each function with zeros of its derivative. - A derivative is positive where its function increases and negative where its function decreases. - Pay attention to the number and locations of local extrema.

Solution

1. Graph A is an upward-opening parabola with a minimum at \(x = 1\). It decreases for \(x < 1\) and increases for \(x > 1\), so its derivative must be an increasing line that is zero at \(x = 1\). Therefore, A matches (2). 2. Graph B has a local maximum at \(x = -2\) and a local minimum at \(x = 2\). Its derivative must be zero at \(x = -2\) and \(x = 2\), negative between those values, and positive outside them. Therefore, B matches (3). 3. Graph C has a maximum at \(x = 0\), increases for \(x < 0\), and decreases for \(x > 0\). Its derivative must be positive to the left of \(0\), zero at \(0\), and negative to the right. Therefore, C matches (1).

Answer

A \(\rightarrow\) (2); B \(\rightarrow\) (3); C \(\rightarrow\) (1)
Functions and their derivative graphs 93
Panel 1 shows a cubic function \(f\) and its tangent line \(t\) at \(P(2,2)\). Panel 2 shows three candidate derivative graphs, \(g_1\), \(g_2\), and \(g_3\). a) Find the slope of \(t\) from the graph. What is \(f'(2)\)? b) Use this value and the extrema and monotonicity of \(f\) to identify which candidate is \(f'\).
Figure for problem 532524

Hints

- The derivative value equals the tangent slope. - Use two points on \(t\) to calculate its slope. - The derivative is zero at smooth local extrema. - Match the sign of each candidate to the increasing and decreasing intervals of \(f\).

Solution

1. The tangent passes through \(P(2,2)\) and \((4,0)\). Its slope is \(\frac{0-2}{4-2}=-1\), so \(f'(2)=-1\). 2. All three candidates have value \(-1\) at \(x=2\), so that value alone does not determine the answer. 3. The graph of \(f\) has a local maximum near \(x=0.85\) and a local minimum near \(x=3.15\). Therefore, \(f'\) must have zeros near those inputs. 4. Only \(g_1\) has zeros near \(0.85\) and \(3.15\). It is also positive where \(f\) increases and negative where \(f\) decreases. Thus, \(g_1\) represents \(f'\).

Answer

a) The slope is \(-1\), so \(f'(2)=-1\). b) \(g_1\) represents \(f'\).
Functions and their derivative graphs 94
The graph of a cubic polynomial \(f\) is shown. Decide whether each statement about \(f\) and \(f'\) is true or false. 1) The graph of \(f'\) has exactly two zeros. 2) On \([-2,2]\), the graph of \(f'\) lies above the x-axis. 3) The graph of \(f\) has an inflection point at \((0,1)\). 4) As \(x\to-\infty\), \(f'(x)\to-\infty\).
Figure for problem 532529

Hints

- Zeros of the derivative occur at smooth extrema of the original function. - Use increasing and decreasing behavior to determine the derivative's sign. - Look for where the graph changes concavity. - Consider the slope of the graph far to the left.

Solution

1. Statement 1 is true. The graph of \(f\) has a local maximum at \(x=-2\) and a local minimum at \(x=2\), so \(f'\) has zeros at both inputs. 2. Statement 2 is false. The graph of \(f\) decreases between the extrema, so \(f'(x)<0\) for \(-2<x<2\), with zeros at the endpoints. 3. Statement 3 is true. The change in concavity occurs midway between the symmetric extrema, at \(x=0\), and the graph gives \(f(0)=1\). 4. Statement 4 is false. Far to the left, the graph is increasing ever more steeply, so \(f'(x)\to+\infty\) as \(x\to-\infty\).

Answer

1) True 2) False 3) True 4) False
Functions and their derivative graphs 95
The graph of \(f\) is shown. Which expression represents \(f'\)? Justify your answer. A: \(f'(x)=0.5x^2-x-1.5\) B: \(f'(x)=-0.5x^2+x+1.5\) C: \(f'(x)=x^2-2x-3\) D: \(f'(x)=0.5x^2+x-1.5\)
Figure for problem 532530

Hints

- Find the x-coordinates of the local maximum and minimum. - The derivative must be zero at those inputs. - Use the increasing and decreasing intervals to determine the derivative's sign pattern. - Estimate one slope to distinguish candidates with the same zeros.

Solution

1. The graph of \(f\) has a local maximum at \(x=-1\) and a local minimum at \(x=3\). Therefore, \(f'\) must have zeros at \(-1\) and \(3\). This eliminates option D. 2. The function increases for \(x<-1\) and \(x>3\), so \(f'\) must be positive there. It decreases between the extrema, so \(f'\) must be negative there. Thus, its graph opens upward, eliminating option B. 3. Options A and C have the correct zeros and sign pattern. Estimate the slope of \(f\) near the inflection point \(x=1\). The graph suggests a slope near \(-2\). 4. Option A gives \(f'(1)=0.5-1-1.5=-2\), while option C gives \(f'(1)=1-2-3=-4\). Therefore, option A matches the graph.

Answer

A: \(f'(x)=0.5x^2-x-1.5\)
Functions and their derivative graphs 96
The graph of \(f\) is shown. Decide which statements about \(f'\) are true. Give a detailed justification for each decision. 1) The graph of \(f'\) lies above the x-axis on \((0,4)\). 2) \(f'(2)=0\). 3) \(f'(1)=f'(3)\). 4) \(f'(0)=-2\).
Figure for problem 532531

Hints

- The derivative is the graph's tangent slope. - Relate increasing and decreasing behavior to the sign of the derivative. - At a smooth extremum, the derivative is zero. - Do not confuse a function value with a derivative value. - Use symmetry about the inflection point.

Solution

1. Statement 1 is true. The graph of \(f\) increases throughout \((0,4)\) and has no horizontal tangent there, so \(f'(x)>0\) on that interval. 2. Statement 2 is false. At \(x=2\), the graph has an inflection point with positive slope; the slope is approximately \(3\), not \(0\). 3. Statement 3 is true. The graph is point-symmetric about its inflection point \((2,2)\), so the tangent slopes at inputs equally spaced from \(2\), such as \(1\) and \(3\), are equal. 4. Statement 4 is false. At \(x=0\), the graph has a local minimum, so \(f'(0)=0\). The value \(-2\) is \(f(0)\), not the derivative value.

Answer

1) True 2) False 3) True 4) False
Functions and their derivative graphs 97
The graph of the derivative \(f'\) of a function \(f\) is shown. Determine whether each statement is true or false, and justify your answer. a) The graph of \(f\) has a local minimum at \(x=0\). b) The function \(f\) is strictly decreasing on \([0, 4]\). c) If \(f(0)=2\), then \(f(3)>2\). d) The graph of \(f\) has an inflection point at \(x=2\).
Figure for problem 532542

Hints

- Use the sign of \(f'\) to determine whether \(f\) increases or decreases. - What does a sign-changing zero of the derivative indicate? - Compare function values using monotonicity. - How are extrema of \(f'\) related to inflection points of \(f\)?

Solution

1. At \(x=0\), \(f'\) changes from negative to positive, so \(f\) has a local minimum. Statement a is true. 2. On \((0, 4)\), \(f'(x)>0\), so \(f\) is strictly increasing, not decreasing. Statement b is false. 3. Since \(f'(x)>0\) on \((0, 3]\), \(f(3)>f(0)=2\). Statement c is true. 4. An extremum of \(f'\) corresponds to an inflection point of \(f\). Since \(f'\) has a local maximum at \(x=2\), statement d is true.

Answer

a) True b) False c) True d) True
Functions and their derivative graphs 98
The graph of a function \(f\) has seven marked x-values, \(x_1\) through \(x_7\). Use the graph to answer each question. a) At which marked value is \(f(x)\) smallest? b) Among the five interior values \(x_2, x_3, x_4, x_5, x_6\), where is the tangent slope \(f'(x)\) greatest? c) At which marked value is \(f''(x)<0\)? d) Which marked values correspond to inflection points of \(f\)?
Figure for problem 532555

Hints

- First relate \(f(x)\), \(f'(x)\), and \(f''(x)\) to the graph. - The function value is the point’s vertical coordinate. - The first derivative gives the tangent slope. - A negative second derivative corresponds to concave-down behavior. - An inflection point occurs where the graph changes concavity.

Solution

1. Compare the y-coordinates of all seven marked points. The lowest marked point is at \(x_6\), where \(f(x_6)\approx-1.54\). 2. The first derivative is the tangent slope. The graph is nearly horizontal at \(x_2\), \(x_4\), and \(x_6\), decreasing at \(x_5\), and increasing steeply at \(x_3\). Therefore, the greatest slope among the five interior values occurs at \(x_3\). 3. A negative second derivative means the graph is concave down. The graph is concave down between its inflection-point x-coordinates \(x=-1\) and \(x=2\). Of the marked values, only \(x_4\) lies strictly between them. 4. The graph changes concavity at \(x_3=-1\) and \(x_5=2\). Therefore, the inflection points correspond to \(x_3\) and \(x_5\).

Answer

a) \(x_6\) b) \(x_3\) c) \(x_4\) d) \(x_3\) and \(x_5\)
Functions and their derivative graphs 99
The graph shown is the first derivative \(f'\) of a polynomial function \(f\). Determine whether each statement is true or false. a) The graph of \(f\) is concave down on \([0, 2]\). b) The graph of \(f\) has an inflection point at \(x=1\). c) On the displayed interval \(-3\le x\le5\), the graph of \(f\) has exactly two inflection points. d) The function \(f\) is strictly decreasing on \([1, 4]\). e) The graph of \(f\) has a local maximum at \(x=-2\).
Figure for problem 532558

Hints

- Review how monotonicity, concavity, extrema, and inflection points of \(f\) appear in the graph of \(f'\). - Connect the sign of \(f'\) to whether \(f\) is increasing or decreasing. - Connect the monotonicity of \(f'\) to the concavity of \(f\). - What sign changes of \(f'\) produce local extrema of \(f\)? - Where does \(f\) have inflection points when the graph of \(f'\) is given?

Solution

1. Statement a is true. The graph of \(f'\) is decreasing on \([0, 2]\), so \(f''(x)<0\) there and \(f\) is concave down. 2. Statement b is false. At \(x=1\), \(f'\) changes from positive to negative, so \(f\) has a local maximum. The graph of \(f'\) does not have a local extremum there, so \(f\) does not have an inflection point there. 3. Statement c is true. The graph of \(f'\) has local extrema at \(x=1-\sqrt{3}\approx-0.73\) and \(x=1+\sqrt{3}\approx2.73\). Therefore, \(f\) has exactly two inflection points on the displayed interval. 4. Statement d is true. On \((1, 4)\), \(f'(x)<0\), with zeros only at the endpoints. Therefore, \(f\) is strictly decreasing on \([1, 4]\). 5. Statement e is false. At \(x=-2\), \(f'\) changes from negative to positive, so \(f\) has a local minimum.

Answer

a) True b) False c) True d) True e) False
Functions and their derivative graphs 100
a) Use the graphs of \(f'\) and \(f''\) to estimate and classify all local extrema of \(f\). Justify each classification with the second derivative test. b) Why is \(f'(x_0)=0\) necessary at an interior extremum of a differentiable function, but not sufficient? c) Find the x-coordinates of all inflection points and describe how concavity changes at each.
Figure for problem 532562

Hints

- Locate the zeros of \(f'\) first. - At those zeros, use \(f''\) to decide the type of extremum. - Can a horizontal tangent occur without a turning point? - For concavity changes, look for sign changes in \(f''\).

Solution

1. The graph of \(f'\) crosses the x-axis at about \(x=-2.5\), \(x=1\), and \(x=4.5\). 2. At the two outer zeros, the graph of \(f''\) is positive, giving local minima. At \(x=1\), it is negative, giving a local maximum. 3. At an interior local extremum of a differentiable function, the tangent slope is zero. But a horizontal tangent can occur without an extremum, as with \(g(x)=x^3\) at \(x=0\). A sign change in \(f'\) or a nonzero second derivative can give a sufficient condition. 4. The graph of \(f''\) changes sign at \(x=-1\) and \(x=3\). The concavity changes up to down at \(-1\), and down to up at \(3\).

Answer

a) Local minima near \(x=-2.5\) and \(x=4.5\); local maximum at \(x=1\). b) A zero of \(f'\) identifies a candidate but does not guarantee an extremum. c) Inflection input \(x=-1\): up to down. Inflection input \(x=3\): down to up.
Functions and their derivative graphs 101
The function \(f\) is defined by \(f(x)=\frac{1}{3}x^3-x^2-3x+2\). The displayed graph represents a function \(g\). Give three different mathematical reasons—such as end behavior, sign, or behavior at critical numbers—showing that the displayed graph cannot represent the derivative \(f'\).
Figure for problem 532564

Hints

- First compute \(f'(x)\). - Compare the degree and leading coefficient with the displayed graph. - Compare signs on intervals where \(f\) increases or decreases. - Compare the directions of sign changes at the zeros.

Solution

1. Differentiate: \(f'(x)=x^2-2x-3\). 2. End behavior: \(f'\) is an upward-opening parabola, so \(f'(x)\to\infty\) as \(x\to\pm\infty\). The displayed graph opens downward. 3. Sign and monotonicity: \(f'(x)<0\) on \((-1,3)\), so \(f\) decreases there. The displayed graph is positive on that interval. 4. Critical-number behavior: At \(x=-1\), the true derivative changes from positive to negative, which gives \(f\) a local maximum. The displayed graph changes from negative to positive there, which would indicate a local minimum.

Answer

Three valid reasons are: 1. The true derivative \(f'(x)=x^2-2x-3\) opens upward, but the displayed graph opens downward. 2. The true derivative is negative on \((-1,3)\), but the displayed graph is positive there. 3. At \(x=-1\), the true derivative changes from positive to negative, while the displayed graph changes from negative to positive.
Functions and their derivative graphs 102
The graph shown is the derivative \(f'\) of a function \(f\). a) Find and classify the critical numbers of \(f\). b) Determine the intervals where \(f\) is concave up and concave down. c) Find the x-coordinates of all inflection points of \(f\). d) Explain why \(f(-2)>f(-4)\).
Figure for problem 532590

Hints

- Use zeros and sign changes of \(f'\) to classify critical numbers of \(f\). - At a zero of \(f'\), check whether the derivative changes sign or only touches the x-axis. - How does the monotonicity of \(f'\) determine the concavity of \(f\)? - Inflection-point x-coordinates of \(f\) correspond to local extrema of \(f'\). - Use the sign of \(f'\) to compare \(f(-2)\) and \(f(-4)\).

Solution

1. At \(x=-4\), \(f'\) changes from negative to positive, so \(f\) has a local minimum. At \(x=-1\), \(f'\) has a double zero and does not change sign, so \(f\) has no local extremum there; instead, it has a stationary inflection point. 2. On the displayed interval, \(f'\) is increasing on \([-5, -3)\) and \((-1, 0.5]\), so \(f\) is concave up there. It is decreasing on \((-3, -1)\), so \(f\) is concave down there. 3. The graph of \(f'\) has local extrema at \(x=-3\) and \(x=-1\). Therefore, these are the x-coordinates of the inflection points of \(f\). 4. For \(-4<x\le-2\), \(f'(x)>0\), so \(f\) is strictly increasing on \([-4, -2]\). Therefore, \(f(-2)>f(-4)\).

Answer

a) Local minimum at \(x=-4\); stationary inflection point at \(x=-1\). b) Concave up on \([-5, -3)\) and \((-1, 0.5]\); concave down on \((-3, -1)\). c) \(x=-3\) and \(x=-1\) d) \(f(-2)>f(-4)\) because \(f\) is strictly increasing on \([-4, -2]\).
Functions and their derivative graphs 103
The graph shows two functions labeled a and b. One graph represents a differentiable function \(f\), and the other represents its derivative \(f'\). Explain which graph is \(f\) and which is \(f'\).
Figure for problem 532598

Hints

- Compare turning points of one graph with zeros of the other. - Compare increasing and decreasing intervals with the sign of the candidate derivative graph. - Both relationships must agree for the match to be valid.

Solution

1. If one graph is \(f'\), its zeros must occur at horizontal tangents of \(f\). 2. Graph a has a local maximum at \(x=-2\) and a local minimum at \(x=2\). Graph b has zeros at exactly \(x=-2\) and \(x=2\). 3. Graph a decreases on \((-2,2)\), while graph b is negative there. Graph a increases for \(x<-2\) and \(x>2\), while graph b is positive there. 4. Therefore, graph a represents \(f\), and graph b represents \(f'\).

Answer

Graph a represents \(f\); graph b represents \(f'\).
Functions and their derivative graphs 104
Panel a) shows the derivative graphs \(f'\) and \(g'\). Panel b) shows four candidate graphs labeled a, b, c, and d for the original functions. Match \(f'\) and \(g'\) with the correct graphs of \(f\) and \(g\). Justify your choices using monotonicity and local extrema.
Figure for problem 532599

Hints

- The sign of a derivative determines whether its original function increases or decreases. - A sign-changing derivative zero corresponds to a local extremum. - Match each candidate using both the critical numbers and the monotonicity pattern.

Solution

1. The graph of \(f'\) has zeros at \(x=0\) and \(x=2\). It is positive for \(x<0\) and \(x>2\), and negative for \(0<x<2\). 2. Therefore, \(f\) must increase, then decrease, then increase, with a local maximum at \(x=0\) and a local minimum at \(x=2\). Candidate a has this behavior. 3. The graph of \(g'\) is positive for \(x<1\), zero at \(x=1\), and negative for \(x>1\). 4. Therefore, \(g\) must increase before \(x=1\), decrease afterward, and have a local maximum at \(x=1\). Candidate b has this behavior.

Answer

\(f'\) matches candidate a for \(f\); \(g'\) matches candidate b for \(g\).
Functions and their derivative graphs 105
The graph of \(f'\) is shown. Determine whether each statement about \(f\) is true or false. Justify your answers. (1) \(f\) is strictly increasing on \([-2,1]\). (2) \(f\) has a local minimum at \(x=1\). (3) The graph of \(f\) has an inflection point at approximately \(x=2.1\). (4) \(f(3)>f(1)\).
Figure for problem 532602

Hints

- Use the sign of \(f'\) for monotonicity and local extrema. - Use whether \(f'\) is increasing or decreasing for concavity. - The comparison \(f(3)\) versus \(f(1)\) follows from monotonicity on \((1,3)\); no accumulation concept is needed.

Solution

1. Statement (1) is true. The graph of \(f'\) is positive on \((-2,1)\), so \(f\) is strictly increasing there. 2. Statement (2) is false. At \(x=1\), \(f'\) changes from positive to negative, so \(f\) has a local maximum. 3. Statement (3) is true. The graph of \(f'\) has a local minimum at approximately \(x=2.1\), changing from decreasing to increasing; therefore \(f\) changes from concave down to concave up there. 4. Statement (4) is false. Since \(f'(x)<0\) on \((1,3)\), \(f\) is strictly decreasing on that interval, so \(f(3)<f(1)\).

Answer

(1) True. (2) False. (3) True. (4) False.
Functions and their derivative graphs 106
Four graphs labeled a, b, c, and d are shown. Three represent a function \(f\), its first derivative \(f'\), and its second derivative \(f''\). Identify the three graphs and explain why the remaining graph cannot belong to the derivative chain.
Figure for problem 532606

Hints

- A derivative's zeros correspond to horizontal tangents of the function above it in the chain. - The sign of a derivative must agree with the increasing/decreasing behavior of its parent function. - Test the graphs pairwise until two consecutive derivative relationships both work.

Solution

1. Graph b has a local maximum at \(x=-1\) and a local minimum at \(x=1\). Graph a has zeros at those x-values and signs consistent with the increasing and decreasing intervals of graph b. Thus graph a is the derivative of graph b. 2. Graph c has extrema where graph b is zero, and its monotonicity agrees with the sign of graph b. Thus graph b is the derivative of graph c. 3. Therefore, graph c represents \(f\), graph b represents \(f'\), and graph a represents \(f''\). 4. Graph d has the opposite monotonicity relationship and cannot complete this derivative chain.

Answer

Graph c is \(f\); graph b is \(f'\); graph a is \(f''\); graph d does not belong.
Functions and their derivative graphs 107
The graph of \(f'\) is shown. a) Find the intervals on which \(f\) is strictly increasing and strictly decreasing. Classify every local extremum. b) A candidate function is \(f(x)=-\frac13x^3+4x-1\). Differentiate it to verify that its derivative matches the displayed graph. c) Does \(f\) have an inflection point at \(x=0\)? Justify your answer from the graph of \(f'\).
Figure for problem 532615

Hints

- Use the sign of the derivative graph for monotonicity and extrema. - Verify the candidate function by differentiating it. - For concavity, track whether the derivative graph is increasing or decreasing.

Solution

1. Since \(f'>0\) on \((-2,2)\), \(f\) is strictly increasing there. Since \(f'<0\) on \(( -\infty,-2)\) and \((2,\infty)\), \(f\) is strictly decreasing there. The sign changes give a local minimum at \(x=-2\) and a local maximum at \(x=2\). 2. Differentiating \(f(x)=-\frac13x^3+4x-1\) gives \(f'(x)=4-x^2\), matching the displayed graph. 3. Yes. The derivative graph has a local maximum at \(x=0\), changing from increasing to decreasing. Therefore \(f\) changes from concave up to concave down at \(x=0\).

Answer

a) Increasing on \((-2,2)\); decreasing on \(( -\infty,-2)\) and \((2,\infty)\). Local minimum at \(x=-2\); local maximum at \(x=2\). b) \(f'(x)=4-x^2\), matching the graph. c) Yes, \(x=0\) is an inflection point.
Functions and their derivative graphs 108
The graph shows a function \(g\) defined for all real numbers. A function \(f\) has derivative \(f'(x) = g(x) - 1\). a) Find the \(x\)-coordinates of all local extrema of \(f\). Classify each as a local maximum or local minimum, and justify your answer. b) Find the \(x\)-coordinate of the inflection point of \(f\). Justify your answer.
Figure for problem 532621

Hints

- Set \(f'(x) = 0\) by finding where \(g(x) = 1\). - Compare \(g(x)\) with \(1\) on each interval. - An inflection point of \(f\) occurs where \(f'\) has a local extremum.

Solution

1. Local extrema of \(f\) occur where \(f'(x) = 0\), so solve \(g(x) = 1\). From the graph, this occurs at \(x = -2\) and \(x = 2\). 2. For \(x < -2\), \(g(x) < 1\), so \(f'(x) < 0\). For \(-2 < x < 2\), \(g(x) > 1\), so \(f'(x) > 0\). Thus, \(f\) has a local minimum at \(x = -2\). 3. For \(-2 < x < 2\), \(f'(x) > 0\), and for \(x > 2\), \(f'(x) < 0\). Thus, \(f\) has a local maximum at \(x = 2\). 4. Since \(f''(x) = g'(x)\), an inflection point of \(f\) occurs where \(g\) has a local extremum. The graph of \(g\) has a maximum at \(x = 0\), so \(f\) has an inflection point there.

Answer

a) Local minimum at \(x = -2\); local maximum at \(x = 2\) b) Inflection point at \(x = 0\)
Functions and their derivative graphs 109
The graph shows the derivative \(f'\) of a differentiable function \(f\) defined for all real numbers. a) Find all local extrema of \(f\). Classify each as a local minimum or local maximum. b) At which \(x\)-value does the graph of \(f\) have its greatest slope? What is that slope? c) Find the \(x\)-values where the tangent to the graph of \(f\) is parallel to the line \(g(x) = 1.5x - 4\). d) The derivative has the form \(f'(x) = a(x-d)^2 + c\). Determine \(a\), \(d\), and \(c\) from the graph.
Figure for problem 532631

Hints

- Use zeros and sign changes of \(f'\) to classify local extrema. - The largest value of \(f'\) is the greatest slope of \(f\). - Parallel lines have equal slopes. - Read the vertex to identify \(d\) and \(c\), then use another point to find \(a\).

Solution

1. The derivative is zero at \(x = 0\) and \(x = 4\). At \(x = 0\), \(f'\) changes from negative to positive, so \(f\) has a local minimum. At \(x = 4\), \(f'\) changes from positive to negative, so \(f\) has a local maximum. 2. The greatest slope of \(f\) is the maximum value of \(f'\). The vertex of the derivative graph is \((2, 2)\), so the greatest slope is \(2\) at \(x = 2\). 3. A line parallel to \(g\) must have slope \(1.5\). The graph shows \(f'(x) = 1.5\) at \(x = 1\) and \(x = 3\). 4. The vertex gives \(d = 2\) and \(c = 2\). Using \((0, 0)\), \(0 = a(0-2)^2 + 2\), so \(4a = -2\) and \(a = -0.5\).

Answer

a) Local minimum at \(x = 0\); local maximum at \(x = 4\) b) Greatest slope \(2\) at \(x = 2\) c) \(x = 1\) and \(x = 3\) d) \(a = -0.5\), \(d = 2\), and \(c = 2\)
Functions and their derivative graphs 110
Let \(f(x)=1.5\ln(x^2+1)+1\). The graph shows \(f\), \(f'\), and \(f''\), labeled a, b, and c. a) Match graphs a, b, and c with \(f\), \(f'\), and \(f''\). Justify your choices. b) Find the exact slope of \(f\) at \(x=2\). c) Find \(\lim_{x\to\pm\infty}f''(x)\) and state the horizontal asymptote of the graph of \(f''\).
Figure for problem 532640

Hints

- Compare zeros and extrema to test which graph could be the derivative of another. - The slope of \(f\) is read from \(f'\). - Compare numerator and denominator degrees for the end behavior of \(f''\).

Solution

1. Graph a represents \(f\). Its derivative is \(f'(x)=\frac{3x}{x^2+1}\), which is graph b. Differentiating again gives \(f''(x)=\frac{3-3x^2}{(x^2+1)^2}\), which is graph c. 2. The slope of \(f\) at \(x=2\) is \(f'(2)=\frac65\). 3. The denominator of \(f''\) has higher degree than its numerator, so \(f''(x)\to0\) as \(x\to\pm\infty\). The horizontal asymptote is \(y=0\).

Answer

a) a: \(f\); b: \(f'\); c: \(f''\). b) \(\frac65\). c) \(\lim_{x\to\pm\infty}f''(x)=0\); horizontal asymptote \(y=0\).
Functions and their derivative graphs 111
Panel a) shows the graph of \(f'\) on \(-2.5\le x\le2.5\). Panels b), c), and d) are candidate graphs for \(f\) on the same displayed interval. Which candidate graph is consistent with \(f'\)? Justify your choice from the sign of \(f'\). Then state the displayed intervals on which \(f\) is increasing or decreasing and give the x-coordinates of the local extrema indicated by the derivative sign changes.
Figure for problem 532643

Hints

- Read where the derivative graph is above and below the x-axis. - Translate positive derivative into increasing behavior and negative derivative into decreasing behavior. - Look for sign changes of the derivative before comparing the candidate function graphs.

Solution

1. In panel a), \(f'(x)>0\) for \(-2.5<x<-1\), \(f'(x)<0\) for \(-1<x<1\), and \(f'(x)>0\) for \(1<x<2.5\). 2. Therefore \(f\) must increase, then decrease, then increase across those three intervals. 3. Candidate b) has exactly that monotonicity pattern. Candidate c) has the opposite pattern, and candidate d) is increasing throughout the displayed interval. 4. Because \(f'\) changes from positive to negative at \(x=-1\), \(f\) has a local maximum there. Because \(f'\) changes from negative to positive at \(x=1\), \(f\) has a local minimum there.

Answer

Panel b) is consistent with \(f'\). \(f\) is increasing on \((-2.5,-1)\), decreasing on \((-1,1)\), and increasing on \((1,2.5)\). Local maximum x-coordinate: \(-1\). Local minimum x-coordinate: \(1\).
Functions and their derivative graphs 112
The graph of \(f'\) is shown. Determine whether each statement about \(f\) is true or false. Justify your answer. (1) \(f\) is strictly decreasing on \([-2,2]\). (2) \(f\) has a local maximum at \(x=2\). (3) The graph of \(f\) is concave up on \([0,3]\). (4) The graph of \(f\) has exactly two inflection points.
Figure for problem 532649

Hints

- Use the sign of \(f'\) for monotonicity and local extrema. - Use whether \(f'\) is increasing or decreasing for concavity. - Count changes in the direction of \(f'\), not merely zeros of \(f'\), when finding inflection points.

Solution

1. On \((-2,2)\), \(f'(x)<0\), so \(f\) is strictly decreasing. Statement (1) is true. 2. At \(x=2\), \(f'\) changes from negative to positive, so \(f\) has a local minimum, not a local maximum. Statement (2) is false. 3. On \((0,3)\), the graph of \(f'\) is increasing, so \(f\) is concave up. Statement (3) is true. 4. Inflection points of \(f\) occur where \(f'\) changes between decreasing and increasing. The parabola \(f'\) has only one extremum, at \(x=0\), so \(f\) has exactly one inflection point. Statement (4) is false.

Answer

(1) True. (2) False. (3) True. (4) False.
Functions and their derivative graphs 113
The graph shows the derivative \(f'\) of a polynomial function \(f\) on \([-4, 6]\). a) Find the intervals on which \(f\) is strictly increasing and strictly decreasing. b) Find the \(x\)-coordinates of all local extrema of \(f\), and classify each as a local minimum or local maximum. c) Does the graph of \(f\) have an inflection point? Justify your answer using the graph of \(f'\), and give its \(x\)-coordinate if it exists.
Figure for problem 532654

Hints

- Use the sign of \(f'\) to determine increasing and decreasing intervals. - Use the direction of each sign change to classify local extrema. - A local extremum of \(f'\) corresponds to a possible inflection point of \(f\).

Solution

1. The derivative is negative on \((-4, -1)\) and \((3, 6)\), so \(f\) is strictly decreasing on \([-4, -1]\) and \([3, 6]\). It is positive on \((-1, 3)\), so \(f\) is strictly increasing on \([-1, 3]\). 2. At \(x = -1\), \(f'\) changes from negative to positive, so \(f\) has a local minimum. At \(x = 3\), \(f'\) changes from positive to negative, so \(f\) has a local maximum. 3. The graph of \(f'\) has a local maximum at \(x = 1\). Therefore, \(f''\) changes sign there, so \(f\) changes concavity and has an inflection point at \(x = 1\).

Answer

a) Increasing on \([-1, 3]\); decreasing on \([-4, -1]\) and \([3, 6]\) b) Local minimum at \(x = -1\); local maximum at \(x = 3\) c) Yes; the inflection point occurs at \(x = 1\).
Functions and their derivative graphs 114
The graph of a quadratic derivative \(g'\) is shown. a) Find the x-coordinates of all local extrema of \(g\), and classify each. b) The candidate function \(g(x)=0.5x^3-1.5x^2+2\) satisfies \(g(0)=2\). Differentiate it to verify the derivative graph, then calculate \(g(3)\).
Figure for problem 532662

Hints

- Use derivative sign changes to classify the two critical numbers. - Verify the candidate by differentiating rather than reconstructing it from the derivative. - Substitute \(x=3\) only after the candidate has been verified.

Solution

1. At \(x=0\), \(g'\) changes from positive to negative, so \(g\) has a local maximum. At \(x=2\), \(g'\) changes from negative to positive, so \(g\) has a local minimum. 2. Differentiating the candidate gives \(g'(x)=1.5x^2-3x\), which has zeros \(0\) and \(2\) and vertex \((1,-1.5)\), matching the graph. 3. \(g(3)=0.5(27)-1.5(9)+2=2\).

Answer

a) Local maximum at \(x=0\); local minimum at \(x=2\). b) \(g'(x)=1.5x^2-3x\), matching the graph, and \(g(3)=2\).
Functions and their derivative graphs 115
The graph of the cubic function \(f(x)=0.25x^3-3x\) and its tangent line at the inflection point are shown. a) Use the graph to find the coordinates of the two local extrema. What is true about \(f^{\prime}\) at these points? b) Use the tangent line at \(W(0,0)\) to find \(f^{\prime}(0)\). c) On which interval is the graph concave down, and on which interval is it concave up? State the sign of \(f^{\prime\prime}\) on each interval.
Figure for problem 532678

Hints

- At a smooth local maximum or minimum, the tangent line is horizontal. - Use a rise-over-run calculation on the tangent line at the origin. - Concavity describes whether tangent slopes are decreasing or increasing. - Relate concavity to the sign of the second derivative.

Solution

1. The graph has a local maximum at \((-2,4)\) and a local minimum at \((2,-4)\). The tangent line is horizontal at each point, so \(f^{\prime}(-2)=0\) and \(f^{\prime}(2)=0\). 2. The tangent line at the origin falls \(3\) units for every increase of \(1\) unit in \(x\). Its slope is \(-3\), so \(f^{\prime}(0)=-3\). 3. For \(x<0\), the graph is concave down, so \(f^{\prime\prime}(x)<0\). For \(x>0\), the graph is concave up, so \(f^{\prime\prime}(x)>0\).

Answer

a) Local maximum: \((-2,4)\); local minimum: \((2,-4)\). At both inputs, \(f^{\prime}(x)=0\). b) \(f^{\prime}(0)=-3\) c) Concave down with \(f^{\prime\prime}(x)<0\) for \(x<0\); concave up with \(f^{\prime\prime}(x)>0\) for \(x>0\).
Functions and their derivative graphs 116
The figure shows the graph of \(f\) in black and three candidate graphs: \(g\) in red, \(h\) in blue, and \(k\) in green. One candidate represents \(f^{\prime}\). Which graph is the derivative? Justify your choice by comparing the behavior of \(f\) with the values of the candidate functions.
Figure for problem 533163

Hints

- Locate the horizontal tangent lines on the graph of \(f\). - The derivative must be zero at those inputs. - Determine where \(f\) is increasing and decreasing, then match the derivative sign. - A cubic polynomial has a quadratic derivative.

Solution

1. The graph of \(f\) has a local maximum near \(x=-0.15\) and a local minimum near \(x=2.15\). Therefore, \(f^{\prime}\) must have zeros near those inputs. Both \(g\) and \(h\) have the required zeros. 2. Between the two extrema, \(f\) is decreasing. Therefore, \(f^{\prime}\) must be negative on that interval. 3. Graph \(g\) lies below the x-axis between the two zeros, while graph \(h\) lies above it. Thus, \(g\) has the correct sign pattern. 4. Graph \(k\) has only one zero and is linear, so it cannot be the derivative of the displayed cubic function. Therefore, graph \(g\) represents \(f^{\prime}\).

Answer

The red graph \(g\) represents \(f^{\prime}\).
Functions and their derivative graphs 117
The black graph is \(f'\). The graphs \(g\), \(h\), and \(k\) are candidates for the original function \(f\). Identify the graph of \(f\). Justify your choice using derivative signs, slopes, and critical points.
Figure for problem 533164

Hints

- Zeros of the derivative correspond to horizontal tangents of the original function. - Where \(f'>0\), \(f\) increases; where \(f'<0\), it decreases. - Eliminate candidates that fail either condition.

Solution

1. The derivative graph \(f'\) has zeros at \(x=-2\) and \(x=2\), so \(f\) must have horizontal tangents at those x-values. Graphs \(g\) and \(h\) do, while graph \(k\) does not. 2. On \((-2,2)\), \(f'(x)<0\), so \(f\) must be decreasing there. Graph \(g\) decreases on that interval, while graph \(h\) increases. 3. Therefore, graph \(g\) represents \(f\).

Answer

Graph \(g\) represents \(f\).
Functions and their derivative graphs 118
Figures 1 and 2 show a function \(g\) and its derivative \(g'\), but the figures are not labeled by role. a) Identify which figure is \(g\) and which is \(g'\). Justify your choice using horizontal tangents and derivative zeros. b) Find \(g(2)\). c) Find the slope of \(g\) at \(x=2\). d) Find \(g'(1)\). e) Give one value of \(x\) for which \(g(x)=1\). f) Find all \(x\)-values where \(g\) has a horizontal tangent. g) Give one \(x\)-value where the slope of \(g\) is \(3\).
Figure for problem 533692

Hints

- Identify the graph roles before reading any requested values. - Zeros of a derivative correspond to horizontal tangents of its function. - Once the derivative graph is identified, its y-values give tangent slopes of the function.

Solution

1. Figure 1 is \(g\), and Figure 2 is \(g'\). Figure 1 has horizontal tangents at \(x=-2,0,2\), exactly where Figure 2 crosses the x-axis. 2. Figure 1 gives \(g(2)=-3\). 3. The slope at \(x=2\) is \(g'(2)=0\). 4. Figure 2 gives \(g'(1)=-3\). 5. Figure 1 shows \(g(0)=1\), so \(x=0\) works. 6. Horizontal tangents occur where \(g'(x)=0\), at \(x=-2,0,2\). 7. Figure 2 shows \(g'(-1)=3\), so \(x=-1\) works.

Answer

a) Figure 1 is \(g\); Figure 2 is \(g'\). b) \(g(2)=-3\) c) \(0\) d) \(-3\) e) \(x=0\) f) \(x=-2,0,2\) g) \(x=-1\)
Functions and their derivative graphs 119
The graph of a function \(f\) has a special point at \(x=-1\). 1) Does \(f^{\prime}\) have a zero at \(x=-1\)? Justify your answer. 2) Describe the general shape of \(f^{\prime}\) near \(x=-1\). Does \(f^{\prime}\) change sign at \(x=-1\)?
Figure for problem 533696

Hints

- Examine the tangent line at \((-1,-1)\). - Determine whether the function increases or decreases on each side of \(x=-1\). - A derivative can equal zero without changing sign.

Solution

1. Yes. At \(x=-1\), the graph of \(f\) has a horizontal inflection point, so its tangent line is horizontal and \(f^{\prime}(-1)=0\). 2. The function \(f\) is increasing on both sides of \(x=-1\). Thus, \(f^{\prime}(x)>0\) near \(-1\), except that \(f^{\prime}(-1)=0\). The derivative graph touches the x-axis at \(x=-1\) and does not cross it, so there is no sign change.

Answer

1) Yes, \(f^{\prime}(-1)=0\). 2) No. The derivative is positive on both sides of \(x=-1\), so its graph touches the x-axis without changing sign.
Functions and their derivative graphs 120
The graph of a fourth-degree polynomial \(f\) is shown. 1) Find all inputs where \(f^{\prime}(x)=0\). 2) What is the minimum number of local extrema of \(f^{\prime}\)? Justify your answer using the inflection points of \(f\).
Figure for problem 533697

Hints

- Count the local maxima and minima of \(f\). - A horizontal tangent line gives a zero of \(f^{\prime}\). - An inflection point of \(f\) corresponds to a local extremum of \(f^{\prime}\).

Solution

1. The derivative is zero where the graph of \(f\) has horizontal tangent lines. The graph has local minima at \(x=-2\) and \(x=2\) and a local maximum at \(x=0\). Therefore, \(f^{\prime}(x)=0\) at \(x=-2\), \(x=0\), and \(x=2\). 2. The graph of \(f\) changes concavity once between \(-2\) and \(0\) and once between \(0\) and \(2\). At each inflection point of \(f\), the slope function \(f^{\prime}\) has a local extremum. Thus, \(f^{\prime}\) has at least two local extrema.

Answer

1) \(x=-2\), \(x=0\), and \(x=2\) 2) At least \(2\) local extrema
Functions and their derivative graphs 121
The graph of a periodic function \(f\) is shown. 1) Within the displayed interval, find all inputs where the graph of \(f'\) crosses the x-axis. 2) At what input in \([-4,4]\) does \(f'\) appear to reach its greatest value? Justify your answer using the steepness of \(f\).
Figure for problem 533700

Hints

- Locate the local maximum and local minimum of \(f\). - The derivative is zero at horizontal tangent lines. - Look for the point where the graph rises most steeply.

Solution

1. The derivative is zero at the local extrema of \(f\). The graph has a local minimum at \(x=-\frac{\pi}{2}\) and a local maximum at \(x=\frac{\pi}{2}\). Therefore, the graph of \(f'\) crosses the x-axis at those two inputs. 2. The derivative is greatest where the graph of \(f\) rises most steeply. This occurs at the origin, so \(f'\) reaches its greatest value at \(x=0\).

Answer

1) \(x=-\frac{\pi}{2}\) and \(x=\frac{\pi}{2}\) 2) \(x=0\)
Functions and their derivative graphs 122
The figure shows two functions, \(p\) and \(q\). One graph is the derivative of the other. a) Decide which graph represents the function and which represents its derivative. Justify your answer using the relationship between local extrema and zeros. b) Use the graph to estimate \(p(2)\) and \(p'(2)\).
Figure for problem 533709

Hints

- A smooth local maximum or minimum occurs where the derivative is zero. - Read \(p(2)\) from the graph of \(p\) and \(p'(2)\) from the derivative graph.

Solution

1. The graph of \(p\) has a local maximum at \(x = -1\) and a local minimum at \(x = 3\). The graph of \(q\) is zero at those same \(x\)-values. Therefore, \(q = p'\). 2. Reading from the graph of \(p\), \(p(2) \approx -0.4\). 3. Since \(q = p'\), \(p'(2) = q(2) \approx -1.8\).

Answer

a) \(q\) is the derivative of \(p\), so \(q = p'\). b) \(p(2) \approx -0.4\) and \(p'(2) \approx -1.8\)
Functions and their derivative graphs 123
The graph of \(f\) is shown. Decide whether each statement about \(f^{\prime}\) is true or false. Briefly justify each decision. (1) \(f^{\prime}(0)\) is positive. (2) The graph of \(f^{\prime}\) has exactly two zeros in the displayed interval. (3) On \([1.5,3]\), the graph of \(f^{\prime}\) lies below the x-axis. (4) \(f^{\prime}(2)=f^{\prime}(-2)\). (5) The graph of \(f^{\prime}\) passes through the origin.
Figure for problem 533711

Hints

- The derivative gives the tangent slope of \(f\). - Local extrema of \(f\) produce zeros of \(f^{\prime}\). - Increasing and decreasing intervals determine the sign of the derivative. - Use the symmetry of the original graph to infer the symmetry of its derivative.

Solution

1. Statement (1) is true. The graph of \(f\) is increasing at \(x=0\), so \(f^{\prime}(0)>0\). 2. Statement (2) is true. The graph has two local extrema, near \(x=-1.4\) and \(x=1.4\). The tangent line is horizontal at each point, so \(f^{\prime}\) has exactly two zeros. 3. Statement (3) is true. The graph of \(f\) is decreasing on \([1.5,3]\), so \(f^{\prime}(x)<0\) throughout that interval. 4. Statement (4) is true. The graph of \(f\) has point symmetry about \((0,1)\), so its derivative is symmetric about the y-axis. Therefore, \(f^{\prime}(2)=f^{\prime}(-2)\). 5. Statement (5) is false. Passing through the origin would require \(f^{\prime}(0)=0\), but the graph of \(f\) has positive slope at \(x=0\).

Answer

(1) True (2) True (3) True (4) True (5) False
Functions and their derivative graphs 124
The graph of \(g(x)=\frac{4}{x^2+1}\) is shown. Which statements about \(g'\) are true? For statements about the displayed interval, describe the graph feature that supports your decision. Use the derivative formula to check all five statements. (1) \(g'(0)=0\). (2) \(g'(x)>0\) for every \(x<0\). (3) The derivative \(g'\) has exactly two zeros on \([-4,4]\). (4) \(g'(1)<0\). (5) The graph of \(g'\) is symmetric about the origin.
Figure for problem 533712

Hints

- Find the derivative from the given formula to check statements extending beyond the graph. - Examine the signs of its numerator and denominator separately. - Test what happens when \(x\) is replaced by \(-x\).

Solution

1. By the quotient rule, \(g'(x)=\frac{-8x}{(x^2+1)^2}\). 2. Statement (1) is true: the graph has a smooth maximum at \(0\), and \(g'(0)=0\). 3. Statement (2) is true: for \(x<0\), the numerator \(-8x\) is positive and the denominator is positive. 4. Statement (3) is false: the derivative has exactly one zero, at \(x=0\). 5. Statement (4) is true: the graph falls near \(1\), and \(g'(1)=-2<0\). 6. Statement (5) is true: \(g'(-x)=-g'(x)\), so its graph is symmetric about the origin.

Answer

(1) True; horizontal tangent at \(x=0\). (2) True; the derivative formula is positive for \(x<0\). (3) False; the pictured curve has only one horizontal tangent in the interval, at \(x=0\), and the derivative formula confirms it is the only zero. (4) True; graph falls near \(1\), where \(g'(1)=-2\). (5) True; \(g'(-x)=-g'(x)\).
Functions and their derivative graphs 125
The graph of a fourth-degree polynomial \(f\) is shown. a) Find all inputs where \(f^{\prime}(x)=0\). b) Describe the graph of \(f^{\prime}\), using the monotonicity of \(f\).
Figure for problem 533720

Hints

- Horizontal tangent lines on \(f\) give zeros of \(f^{\prime}\). - Determine whether \(f\) increases or decreases on each interval between its extrema. - The derivative of a fourth-degree polynomial is cubic. - Use the symmetry of \(f\) to check the symmetry of \(f^{\prime}\).

Solution

1. The graph of \(f\) has local maxima at \(x=-2\) and \(x=2\) and a local minimum at \(x=0\). Therefore, \(f^{\prime}(-2)=0\), \(f^{\prime}(0)=0\), and \(f^{\prime}(2)=0\). 2. The function increases for \(x<-2\), decreases for \(-2<x<0\), increases for \(0<x<2\), and decreases for \(x>2\). Thus, \(f^{\prime}\) has the sign pattern positive, negative, positive, negative across those intervals. 3. Since \(f\) is a fourth-degree polynomial, \(f^{\prime}\) is cubic. It is an origin-symmetric cubic that crosses the x-axis at \(x=-2\), \(x=0\), and \(x=2\) with the sign pattern positive, negative, positive, negative from left to right.

Answer

a) \(x=-2\), \(x=0\), and \(x=2\) b) An origin-symmetric cubic crossing the x-axis at \(x=-2\), \(x=0\), and \(x=2\), with signs \(+,-,+,-\) from left to right.
Functions and their derivative graphs 126
The graph of a cubic function \(f\) has a horizontal inflection point at \(x=1\). Describe the graph of \(f^{\prime}\). Explain how the horizontal inflection point appears on the derivative graph.
Figure for problem 533721

Hints

- Determine the tangent slope at a horizontal inflection point. - Check whether the original function is increasing or decreasing on each side. - A zero without a sign change appears as a touch rather than a crossing of the x-axis.

Solution

1. At the horizontal inflection point, the tangent line is horizontal, so \(f^{\prime}(1)=0\). 2. The graph of \(f\) is increasing on both sides of \(x=1\), so \(f^{\prime}(x)>0\) for \(x\ne1\). 3. Because the displayed function is cubic, its derivative is quadratic. The derivative graph is an upward-opening parabola with vertex \((1,0)\); the visible slopes of \(f\) determine its vertical scale. 4. The horizontal inflection point of \(f\) appears as a zero of \(f^{\prime}\) where the derivative graph touches the x-axis without changing sign.

Answer

The derivative graph is an upward-opening parabola with vertex \((1,0)\). It touches the x-axis there without changing sign.
Functions and their derivative graphs 127
The graph shown is the derivative \(f'\) of a function \(f\). Determine whether each statement is true or false, and justify your answer from the graph. 1) The function \(f\) has exactly two inflection points on \([-3, 3]\). 2) The graph of \(f\) is concave down on \([0, 2]\). 3) \(f(2)<f(3)\). 4) The function \(f\) has a local minimum at \(x=0\).
Figure for problem 533772

Hints

- Local extrema of \(f'\) correspond to inflection points of \(f\). - The monotonicity of \(f'\) determines the concavity of \(f\). - What does a positive derivative imply when comparing two function values? - Use the sign change of \(f'\) to classify a critical number of \(f\).

Solution

1. Statement 1 is true. The graph of \(f'\) has two local extrema on \([-3, 3]\), so \(f\) has two inflection points. 2. Statement 2 is false. The derivative \(f'\) decreases only until \(x=\frac{2}{\sqrt{3}}\approx1.15\), then increases. Therefore, \(f\) is not concave down on the entire interval \([0, 2]\). 3. Statement 3 is true. Since \(f'(x)>0\) for \(2<x<3\), the function \(f\) is increasing there. Therefore, \(f(2)<f(3)\). 4. Statement 4 is false. At \(x=0\), \(f'\) changes from positive to negative, so \(f\) has a local maximum, not a local minimum.

Answer

1) True 2) False 3) True 4) False
Functions and their derivative graphs 128
The graph shown is the derivative \(f'\) of a function \(f\). Determine whether each statement is true or false, and justify your answer. a) The function \(f\) is strictly decreasing on \([1, 3]\). b) The graph of \(f\) has a local maximum at \(x=1\). c) The graph of \(f\) is concave up at \(x=0\).
Figure for problem 533777

Hints

- Use the sign of \(f'\) to determine whether \(f\) is increasing or decreasing. - Use sign changes of \(f'\) to classify critical points of \(f\). - The monotonicity of \(f'\) determines the concavity of \(f\).

Solution

1. Statement a is true. On \((1, 3)\), \(f'(x)<0\), with zeros at the endpoints. Therefore, \(f\) is strictly decreasing on \([1, 3]\). 2. Statement b is true. At \(x=1\), \(f'\) changes from positive to negative, so \(f\) has a local maximum. 3. Statement c is false. At \(x=0\), the graph of \(f'\) is decreasing, so \(f''(0)<0\). Therefore, \(f\) is concave down there.

Answer

a) True b) True c) False
Functions and their derivative graphs 129
Match each description to an input labeled A, B, C, or D on the graph of \(f\). 1) The function is decreasing and the graph is concave up. 2) The function is increasing and the graph is concave down. 3) The slope of \(f\) is at its minimum value.
Figure for problem 533778

Hints

- Use the sign of \(f'\) to decide whether the graph is increasing or decreasing. - Use the sign of \(f''\) to decide whether the graph is concave up or concave down. - The smallest value of \(f'\) is the steepest downward slope of the graph.

Solution

1. At A, where \(x=-1\), the graph is increasing and concave down: \(f'(-1)>0\) and \(f''(-1)<0\). This matches description 2. 2. At B, where \(x=1\), the slope is most negative because \(f''(x)=1.2(x-1)\) changes from negative to positive. This matches description 3. 3. At C, where \(x=2\), the graph is decreasing and concave up: \(f'(2)<0\) and \(f''(2)>0\). This matches description 1. 4. At D, the graph is increasing and concave up, so D matches none of the descriptions.

Answer

1) C 2) A 3) B
Functions and their derivative graphs 130
The graph shows the derivative \(f'\) of a function \(f\). a) Find the \(x\)-coordinates of all local extrema of \(f\) in the displayed interval. Classify each as a local maximum or local minimum, and justify your answer using the sign changes of \(f'\). b) Find the interval or intervals on which \(f\) is strictly decreasing. c) How many inflection points does \(f\) have for \(-4 < x < 6\)? Justify your answer using the graph of \(f'\).
Figure for problem 533800

Hints

- Use zeros and sign changes of \(f'\) to identify local extrema. - The function decreases where its derivative is negative. - Inflection points of \(f\) correspond to local extrema of \(f'\).

Solution

1. The derivative is zero at \(x = -3\), \(x = 1\), and \(x = 5\). 2. At \(x = -3\), \(f'\) changes from negative to positive, so \(f\) has a local minimum. At \(x = 1\), it changes from positive to negative, so \(f\) has a local maximum. At \(x = 5\), it changes from negative to positive, so \(f\) has a local minimum. 3. The derivative is negative on \((-4, -3)\) and \((1, 5)\), so \(f\) is strictly decreasing on \([-4, -3]\) and \([1, 5]\). 4. Inflection points of \(f\) occur where \(f'\) has local extrema. The derivative graph has exactly two local extrema in the displayed interval, so \(f\) has two inflection points.

Answer

a) Local minima at \(x = -3\) and \(x = 5\); local maximum at \(x = 1\) b) \([-4, -3]\) and \([1, 5]\) c) Two inflection points
Functions and their derivative graphs 131
The graph shows the first derivative \(f'\) of a polynomial function \(f\). a) Explain why \(f\) has an inflection point at \(x=3\). b) Decide whether \(f(1)\) or \(f(3)\) is greater. Justify your answer using the monotonic behavior of \(f\). c) Read the slope of the tangent line to \(f\) at \(x=0\) from the graph.
Figure for problem 533801

Hints

- An extremum of \(f'\) can correspond to an inflection point of \(f\). - Use the sign of \(f'\) between \(x=1\) and \(x=3\). - The tangent slope of \(f\) at a point equals the value of \(f'\) there.

Solution

1. The graph of \(f'\) has a local maximum at \(x=3\). Its slope, \(f''\), changes from positive to negative there, so \(f\) changes concavity. Therefore, \(f\) has an inflection point at \(x=3\). 2. The derivative satisfies \(f'(x)>0\) for \(1<x<3\), so \(f\) is strictly increasing on \([1, 3]\). Therefore, \(f(3)>f(1)\). 3. The tangent slope at \(x=0\) is \(f'(0)\). From the graph, \(f'(0)=-2.5\).

Answer

a) \(x=3\), because \(f'\) has a local maximum there and \(f''\) changes sign b) \(f(3)>f(1)\) c) \(f'(0)=-2.5\)
Functions and their derivative graphs 132
The graphs of \(g_1\) and \(g_2\) represent \(f'\) and \(f''\) for a function \(f\). a) Match each graph to its derivative and justify your choice. b) Find and classify the horizontal tangents of \(f\) using the second derivative test.
Figure for problem 533804

Hints

- Compare the polynomial degrees and the locations of local extrema and zeros. - Horizontal tangents of \(f\) occur where \(f'=0\). - Use the sign of \(f''\) to classify each candidate.

Solution

1. The cubic graph \(g_1\) has extrema at the zeros of the quadratic graph \(g_2\). The signs also match, so \(g_1=f'\) and \(g_2=f''\). 2. Zeros of \(f'\) occur at \(x=-3\), \(x=0\), and \(x=3\). 3. Since \(f''(-3)=3.6>0\) and \(f''(3)=3.6>0\), these are local minima. Since \(f''(0)=-1.8<0\), \(x=0\) is a local maximum.

Answer

a) \(g_1=f'\); \(g_2=f''\). b) Local minima at \(x=-3\) and \(x=3\); local maximum at \(x=0\).
Functions and their derivative graphs 133
Let \(f(x)=\frac{1}{3}x^3-x\). The four panels show the graphs of \(f\), its derivative \(f'\), and the transformed functions \(g(x)=f(x)+2\) and \(h(x)=f(x-2)\). Match graphs I through IV to the four functions.
Figure for problem 533807

Hints

- Compare the general shapes of a cubic function and its derivative. - The derivative is zero where the original graph has horizontal tangents. - Adding a constant outside a function shifts its graph vertically. - Replacing \(x\) with \(x-c\) shifts a graph horizontally.

Solution

1. Differentiate: \(f'(x)=x^2-1\). This is an upward-opening parabola with vertex \((0, -1)\) and zeros at \(x=-1\) and \(x=1\), so it is graph I. 2. The original function \(f\) is the cubic with a local maximum at \((-1, \frac{2}{3})\) and a local minimum at \((1, -\frac{2}{3})\), so it is graph II. 3. The function \(h(x)=f(x-2)\) shifts the graph of \(f\) right \(2\) units, so it is graph III. 4. The function \(g(x)=f(x)+2\) shifts the graph of \(f\) up \(2\) units, so it is graph IV.

Answer

I: \(f^{\prime}(x)\); II: \(f(x)\); III: \(h(x)=f(x-2)\); IV: \(g(x)=f(x)+2\).
Functions and their derivative graphs 134
The graph shows the derivative \(f'\) of a function \(f\). Determine whether each statement is true or false, and briefly justify your answer. a) The graph of \(f\) has a local maximum at \(x = 0\). b) The function \(f\) is strictly decreasing on \([0, 4]\). c) The graph of \(f\) has an inflection point at \(x = 2\).
Figure for problem 533815

Hints

- Use zeros and sign changes of \(f'\) to identify local extrema. - The function decreases where \(f' < 0\). - A local extremum of \(f'\) indicates a possible inflection point of \(f\).

Solution

1. At \(x = 0\), \(f'\) changes from positive to negative, so \(f\) has a local maximum. Statement a) is true. 2. For \(0 < x < 4\), \(f'(x) < 0\), so \(f\) is strictly decreasing on \([0, 4]\). Statement b) is true. 3. The graph of \(f'\) has a local minimum at \(x = 2\), so \(f''\) changes sign there. Therefore, \(f\) changes concavity and has an inflection point at \(x = 2\). Statement c) is true.

Answer

a) True b) True c) True
Functions and their derivative graphs 135
The graph shown is the first derivative \(f'\) of a polynomial function \(f\) on \(-1\le x\le5\). Determine whether each statement is true or false. a) The graph of \(f\) is concave up for \(2<x\le5\). b) The function \(f\) has a local maximum at \(x=4\). c) The function \(f\) has an inflection point at \(x=2\). d) The function \(f\) is strictly decreasing on \([0, 2]\).
Figure for problem 533846

Hints

- The monotonicity of \(f'\) determines the concavity of \(f\). - Use sign changes of \(f'\) to identify local extrema of \(f\). - Local extrema of \(f'\) correspond to inflection points of \(f\). - Use the sign of \(f'\) to determine whether \(f\) increases or decreases.

Solution

1. Statement a is false. For \(x>2\), the graph of \(f'\) is decreasing, so \(f''(x)<0\) and \(f\) is concave down. 2. Statement b is true. At \(x=4\), \(f'\) changes from positive to negative, so \(f\) has a local maximum. 3. Statement c is true. The graph of \(f'\) has a local maximum at \(x=2\), so the concavity of \(f\) changes there. 4. Statement d is false. For \(0<x<2\), \(f'(x)>0\), so \(f\) is strictly increasing there.

Answer

a) False b) True c) True d) False
Functions and their derivative graphs 136
The graph of the derivative \(f^{\prime}\) is shown on \([-4, 4]\). Use the graph to answer the following questions about \(f\) on the displayed interval. 1. Find the x-coordinates of all local extrema of \(f\), and classify each as a local maximum or local minimum. 2. On what intervals is \(f\) strictly decreasing? 3. At what x-values does \(f\) have inflection points? Briefly justify your answer.
Figure for problem 533915

Hints

- Zeros and sign changes of \(f^{\prime}\) determine local extrema of \(f\). - The function \(f\) decreases where \(f^{\prime}<0\). - Inflection points of \(f\) occur where \(f^{\prime}\) changes monotonicity.

Solution

1. Local extrema of \(f\) occur where \(f^{\prime}\) changes sign. The graph has zeros at approximately \(x=-2.4\), \(x=0\), and \(x=2.4\). The sign changes from negative to positive at \(x\approx-2.4\), so \(f\) has a local minimum there. It changes from positive to negative at \(x=0\), so \(f\) has a local maximum there. It changes from negative to positive at \(x\approx2.4\), so \(f\) has a local minimum there. 2. The function \(f\) is strictly decreasing where \(f^{\prime}<0\), which on the displayed interval is approximately \((-4, -2.4)\) and \((0, 2.4)\). 3. Inflection points of \(f\) occur where \(f^{\prime}\) changes from increasing to decreasing or from decreasing to increasing. The graph of \(f^{\prime}\) has local extrema at approximately \(x=-1.4\) and \(x=1.4\), so those are the inflection-point x-values of \(f\).

Answer

1. Local minima at \(x\approx-2.4\) and \(x\approx2.4\); local maximum at \(x=0\) 2. Approximately \((-4, -2.4)\) and \((0, 2.4)\) 3. Approximately \(x=-1.4\) and \(x=1.4\)
Functions and their derivative graphs 137
Match each function graph, (1), (2), and (3), with its derivative graph, (A), (B), or (C). Explain your choices using features such as local extrema, zeros, and increasing and decreasing behavior.
Figure for problem 533921

Hints

- Match local extrema with zeros of the derivative. - Compare increasing and decreasing intervals with the sign of the derivative. - Use the degree and symmetry of each graph as a check.

Solution

1. Graph (1) has local minima at \(x=-2\) and \(x=2\) and a local maximum at \(x=0\). Its derivative must be zero at \(-2\), \(0\), and \(2\), so (1) matches (B). 2. Graph (2) is \(2\sin x\). Its derivative is \(2\cos x\), so (2) matches (C). 3. Graph (3) is a downward-opening parabola with vertex at \(x=0\). Its derivative is a decreasing line through the origin, so (3) matches (A).

Answer

(1) \(\rightarrow\) (B); (2) \(\rightarrow\) (C); (3) \(\rightarrow\) (A).
Functions and their derivative graphs 138
Which graph, (A), (B), or (C), is the derivative of each function graph, (1), (2), and (3)? Match the pairs and justify your choices.
Figure for problem 533922

Hints

- Match local extrema with zeros of the derivative. - Compare increasing and decreasing behavior with the sign of the derivative. - Consider behavior near asymptotes and at the edges of the displayed interval.

Solution

1. Graph (1) is \(e^x - 2\), which is increasing everywhere. Its derivative is \(e^x\), which is always positive, so (1) matches (A). 2. Graph (2) is \(\frac{1}{x}\), which decreases on both parts of its domain. Its derivative is \(-\frac{1}{x^2}\), which is always negative, so (2) matches (C). 3. Graph (3) has a local maximum at \(x = -1\) and a local minimum at \(x = 1\). Its derivative must be an upward-opening parabola with zeros at \(x = -1\) and \(x = 1\), so (3) matches (B).

Answer

(1) \(\rightarrow\) (A); (2) \(\rightarrow\) (C); (3) \(\rightarrow\) (B).
Functions and their derivative graphs 139
Panels a) and b) show two functions, \(f_1\) and \(f_2\). Panel c) shows three possible derivative graphs, \(g_1\), \(g_2\), and \(g_3\). 1. Match \(f_1\) and \(f_2\) with their derivative graphs from panel c). 2. Justify the match for \(f_1\) using the slope behavior of its graph. 3. Find the interval on which \(f_1\) is strictly decreasing.
Figure for problem 533959

Hints

- Match local extrema of a function with zeros of its derivative. - Compare increasing and decreasing intervals with the sign of the derivative. - Use the function types and polynomial degrees as a check.

Solution

1. The function \(f_1\) matches \(g_1\), and \(f_2\) matches \(g_2\). 2. The graph of \(f_1\) has a local maximum at \(x = -2\) and a local minimum at \(x = 2\). Graph \(g_1\) is zero at those values. Between them, \(f_1\) decreases, and \(g_1\) is negative. 3. Therefore, \(f_1\) is strictly decreasing on \([-2, 2]\).

Answer

1. \(f_1 \rightarrow g_1\); \(f_2 \rightarrow g_2\) 2. The zeros and sign of \(g_1\) match the horizontal tangents and monotonicity of \(f_1\). 3. \([-2, 2]\)
Functions and their derivative graphs 140
The figure shows a function \(f\) (blue) and its first derivative \(f'\) (red). a) Explain why the color assignment is correct based on the shapes and behavior of the graphs. b) Find the \(x\)-coordinates of the local extrema of \(f\), and classify each as a local maximum or local minimum. c) Estimate the coordinates of the inflection point of \(f\) to the nearest tenth.
Figure for problem 533972

Hints

- Compare the polynomial degrees. - Match zeros of the derivative with horizontal tangents of the function. - The \(x\)-coordinate of an inflection point of \(f\) corresponds to a local extremum of \(f'\).

Solution

1. The blue graph is cubic and the red graph is quadratic, consistent with differentiation lowering the degree by one. Also, the zeros of the red graph occur at the horizontal tangents of the blue graph. Therefore, blue represents \(f\), and red represents \(f'\). 2. The derivative is zero at \(x = -1\) and \(x = 2\). At \(x = -1\), \(f'\) changes from positive to negative, so \(f\) has a local maximum. At \(x = 2\), it changes from negative to positive, so \(f\) has a local minimum. 3. The vertex of the derivative graph is at \(x = 0.5\), so \(f\) changes concavity there. Reading the blue graph to the nearest tenth gives \(f(0.5) \approx 0.4\), so the inflection point is approximately \((0.5, 0.4)\).

Answer

a) Blue represents \(f\), and red represents \(f'\). b) Local maximum at \(x = -1\); local minimum at \(x = 2\) c) Approximately \((0.5, 0.4)\)
Functions and their derivative graphs 141
The graph shows the derivative \(f'\) of a function \(f\) on \([-2.5, 2.5]\). 1. Determine the number and type of local extrema of \(f\) in \((-2.5, 2.5)\). Estimate their \(x\)-coordinates to the nearest tenth. 2. On which intervals is the graph of \(f\) concave up? Justify your answer using the graph of \(f'\). 3. Find the \(x\)-coordinates of the inflection points of \(f\).
Figure for problem 533984

Hints

- Use zeros and sign changes of \(f'\) to classify local extrema. - The function is concave up where its derivative is increasing. - Inflection points of \(f\) correspond to local extrema of \(f'\).

Solution

1. The derivative is zero and changes sign at approximately \(x \approx -1.7\), \(x = 0\), and \(x \approx 1.7\). At the first and third values, it changes from negative to positive, giving local minima. At \(x = 0\), it changes from positive to negative, giving a local maximum. 2. The graph of \(f\) is concave up where \(f'\) is increasing. The derivative graph increases on \((-2.5, -1)\) and \((1, 2.5)\). 3. Inflection points of \(f\) occur where \(f'\) has local extrema. These occur at \(x = -1\) and \(x = 1\).

Answer

1. Local minima at approximately \(x \approx -1.7\) and \(x \approx 1.7\); local maximum at \(x = 0\) 2. Concave up on \((-2.5, -1)\) and \((1, 2.5)\) 3. \(x = -1\) and \(x = 1\)
Functions and their derivative graphs 142
The graph shown is \(f'\) on \([-3,1]\). Give a text-only graph blueprint for \(f\) on that interval. a) State the maximal intervals on which \(f\) is increasing and decreasing. b) Classify each horizontal tangent of \(f\) shown by a zero of \(f'\). c) Use the local extrema of the graph of \(f'\) to identify the inflection-point x-coordinates of \(f\); give the noninteger value to the nearest tenth. d) At what x-value does \(f\) attain its greatest value on \([-3,1]\)?
Figure for problem 533988

Hints

- The sign of \(f'\) gives the direction of the original function. - A zero of \(f'\) that merely touches the x-axis behaves differently from a sign-changing zero. - Local extrema of \(f'\) correspond to changes in the concavity of \(f\). - Use the monotonicity on the full displayed interval to determine where the greatest value occurs.

Solution

1. The graph of \(f'\) is positive on \((-3,0)\) except that it touches \(0\) at \(x=-2\), and it is negative on \((0,1)\). Therefore, \(f\) is increasing on \((-3,0)\) and decreasing on \((0,1)\). 2. At \(x=-2\), \(f'\) is zero but does not change sign, so the horizontal tangent is not an extremum. Because \(f'\) has a local minimum there, the concavity of \(f\) changes, making \(x=-2\) a stationary-inflection input. At \(x=0\), \(f'\) changes from positive to negative, so \(f\) has a local maximum. 3. The graph of \(f'\) has local extrema at \(x=-2\) and approximately \(x=-0.7\). Therefore, \(f\) has inflection points at those x-values. 4. Since \(f\) increases up to \(x=0\) and decreases afterward, its greatest value on the displayed interval occurs at \(x=0\).

Answer

a) Increasing on \((-3,0)\); decreasing on \((0,1)\). b) \(x=-2\): stationary inflection point; \(x=0\): local maximum. c) Inflection-point x-coordinates: \(-2\) and approximately \(-0.7\). d) \(x=0\).
Functions and their derivative graphs 143
The graph shown is the first derivative \(f'\) of a function \(f\). a) Find the x-coordinates of the inflection points of \(f\). Explain the relationship you use. b) Determine the intervals in the displayed window where the graph of \(f\) is concave down.
Figure for problem 534000

Hints

- At an inflection point of \(f\), the slope represented by \(f'\) changes from increasing to decreasing or vice versa. - Where does the graph of \(f'\) have local maxima or minima? - How does the monotonicity of \(f'\) determine the concavity of \(f\)? - Concave-down behavior occurs where \(f'\) is decreasing.

Solution

1. Inflection points of \(f\) occur where \(f'\) has local extrema, because the monotonicity of \(f'\) changes there. 2. The graph of \(f'\) has local extrema at \(x=-2\), \(x=0\), and \(x=2\). Therefore, these are the x-coordinates of the inflection points of \(f\). 3. The displayed x-range is \([-3,4]\). The graph of \(f'\) is decreasing on \([-3,-2)\) and \((0,2)\), so \(f\) is concave down on those intervals.

Answer

a) \(x=-2\), \(x=0\), and \(x=2\) b) \([-3, -2)\) and \((0, 2)\)
Functions and their derivative graphs 144
The figure shows two functions, \(k\) and \(m\). One graph represents a function \(f\), and the other represents its derivative \(f'\). Decide which graph represents \(f\) and which represents \(f'\). Justify your answer, especially by comparing the local extrema of \(f\) with the zeros of \(f'\).
Figure for problem 534195

Hints

- Match local extrema of one graph with zeros of the other. - Compare increasing and decreasing intervals with the sign of the possible derivative. - Use the polynomial degrees as a check.

Solution

1. The blue graph \(k\) has a local maximum at \(x = -1\) and a local minimum at \(x = 3\). 2. The red graph \(m\) is zero at \(x = -1\) and \(x = 3\). It is negative on \((-1, 3)\), where \(k\) decreases, and positive outside that interval, where \(k\) increases. 3. Therefore, \(k\) represents \(f\), and \(m\) represents \(f'\).

Answer

The blue graph \(k\) represents \(f\), and the red graph \(m\) represents \(f'\). The zeros and signs of \(m\) match the local extrema and monotonicity of \(k\).
Functions and their derivative graphs 145
Panel a) shows three functions, \(f\), \(g\), and \(h\). Panel b) shows their derivative graphs, \(p\), \(q\), and \(r\). Match each function with its derivative and justify your choices using local extrema, zeros, or increasing and decreasing behavior. Functions: - Blue: \(f\) - Green: \(g\) - Purple: \(h\) Derivatives: - Red: \(p\) - Orange: \(q\) - Gray: \(r\)
Figure for problem 534197

Hints

- Match horizontal tangents with zeros of the derivative. - Compare increasing and decreasing intervals with the sign of the derivative. - Use symmetry and the locations of greatest slopes as additional checks.

Solution

1. The function \(f\) is a parabola with vertex at \(x = 0\). Its derivative must be a line through the origin, so \(f\) matches \(r\). 2. The function \(g\) is cubic with a local minimum at \(x = -2\) and a local maximum at \(x = 2\). Its derivative must be zero at those values and positive between them, so \(g\) matches \(p\). 3. The function \(h\) is sinusoidal. Its derivative is a cosine graph with the same period and is largest at \(x = 0\), where \(h\) has its greatest positive slope. Thus, \(h\) matches \(q\).

Answer

\(f \rightarrow r\); \(g \rightarrow p\); \(h \rightarrow q\).
Functions and their derivative graphs 146
The graph shows the derivative \(f'\) of a function \(f\) on \([-1, 5]\). a) On which intervals is \(f\) strictly increasing? b) At which \(x\)-values does \(f\) have local extrema? Classify each as a local maximum or local minimum. c) What can you conclude about the concavity of \(f\) at \(x = 2\)?
Figure for problem 534198

Hints

- Use the sign of \(f'\) to determine increasing intervals. - Use sign changes at zeros of \(f'\) to classify local extrema. - A local extremum of \(f'\) indicates a possible inflection point of \(f\).

Solution

1. On the displayed interval, the derivative is positive for \(-1 < x < 1\) and \(3 < x < 5\), so \(f\) is strictly increasing on \([-1, 1]\) and \([3, 5]\). 2. At \(x = 1\), \(f'\) changes from positive to negative, so \(f\) has a local maximum. At \(x = 3\), it changes from negative to positive, so \(f\) has a local minimum. 3. The derivative graph has a local minimum at \(x = 2\). Thus, \(f''(2) = 0\) and \(f''\) changes from negative to positive. Therefore, \(f\) changes from concave down to concave up and has an inflection point at \(x = 2\).

Answer

a) \([-1, 1]\) and \([3, 5]\) b) Local maximum at \(x = 1\); local minimum at \(x = 3\) c) \(f\) has an inflection point at \(x = 2\), changing from concave down to concave up.
Functions and their derivative graphs 147
Graph B shows a function \(g\). Decide whether graph 3 or graph 4 represents \(g^{\prime}\). Justify your choice by comparing monotonicity intervals and local extrema.
Figure for problem 534200

Hints

- Locate the local maximum and local minimum of \(g\). - The derivative must be zero at those inputs. - Determine the sign of the derivative between the extrema. - Select the candidate with the matching sign pattern.

Solution

1. The graph of \(g\) has a local maximum near \(x=-1.73\) and a local minimum near \(x=1.73\). 2. Therefore, \(g^{\prime}\) must have zeros near those inputs. Both candidate graphs have the required zeros. 3. Between the two extrema, \(g\) is decreasing, so \(g^{\prime}(x)<0\) there. 4. Graph 3 lies below the x-axis between its zeros, while graph 4 lies above it. Therefore, graph 3 represents \(g^{\prime}\).

Answer

Graph 3 represents \(g^{\prime}\).
Functions and their derivative graphs 148
The graph of a fourth-degree polynomial \(f\) is shown. a) Find the zeros of \(f^{\prime}\) from the graph. b) Describe the graph of \(f^{\prime}\). Explain how the graph of \(f\) tells you whether \(f^{\prime}\) is above or below the x-axis.
Figure for problem 534213

Hints

- Mark every input where the graph has a horizontal tangent line. - Determine whether \(f\) increases or decreases on each interval. - The derivative of a fourth-degree polynomial is cubic. - A steeper graph corresponds to a derivative value farther from zero.

Solution

1. Zeros of \(f^{\prime}\) occur where \(f\) has horizontal tangent lines. The graph has local minima at \(x=-2\) and \(x=2\) and a local maximum at \(x=0\). Thus, the zeros are \(x=-2\), \(x=0\), and \(x=2\). 2. For \(x<-2\), \(f\) is decreasing, so \(f^{\prime}(x)<0\). For \(-2<x<0\), \(f\) is increasing, so \(f^{\prime}(x)>0\). For \(0<x<2\), \(f\) is decreasing, so \(f^{\prime}(x)<0\). For \(x>2\), \(f\) is increasing, so \(f^{\prime}(x)>0\). 3. Since \(f\) is a fourth-degree polynomial, \(f^{\prime}\) is cubic. Its graph crosses the x-axis at \(-2\), \(0\), and \(2\) with the sign pattern negative, positive, negative, positive.

Answer

a) \(x=-2\), \(x=0\), and \(x=2\) b) The derivative graph is cubic. It lies below the x-axis where \(f\) is decreasing and above the x-axis where \(f\) is increasing.
Functions and their derivative graphs 149
The graph of a polynomial function \(f\) is shown. Determine the input where \(f^{\prime}\) has a local extremum, and describe the graph of \(f^{\prime}\). Explain the behavior of \(f^{\prime}\) near the origin.
Figure for problem 534214

Hints

- A local extremum of \(f^{\prime}\) occurs where the tangent slope of \(f\) is largest or smallest. - Look for the inflection point of \(f\). - Use the local extrema of \(f\) to locate zeros of \(f^{\prime}\). - The derivative of a cubic polynomial is quadratic.

Solution

1. The graph of \(f\) has a local maximum at \(x=-2\) and a local minimum at \(x=2\). Therefore, \(f^{\prime}(-2)=0\) and \(f^{\prime}(2)=0\). 2. The graph has an inflection point at the origin, where the slope is most negative. The tangent slope there is approximately \(-3\), so \(f^{\prime}\) has a local minimum at \(x=0\). 3. Since \(f\) is cubic, \(f^{\prime}\) is quadratic. Its graph is an upward-opening parabola with zeros at \(x=-2\) and \(x=2\) and a vertex approximately at \((0,-3)\).

Answer

The derivative has a local minimum at \(x=0\). Its graph is an upward-opening parabola with zeros at \(x=-2\) and \(x=2\) and a vertex approximately at \((0,-3)\).
Functions and their derivative graphs 150
First use the graph of \(f(x)=\frac{4}{1+0.5x^2}\) to describe where \(f\) rises, falls, and has a horizontal tangent in the displayed interval. Then use the formula to describe the graph of \(f'\) for all real \(x\), including: - the zeros of \(f'\), - the intervals where \(f'\) is positive or negative, and - the behavior of \(f'\) as \(x\to\infty\) and \(x\to-\infty\). Check that the derivative signs match what you saw in the graph.
Figure for problem 534215

Hints

- Use the given formula to justify behavior beyond the plotted window. - Determine the derivative's sign from its numerator and denominator. - Compare how quickly numerator and denominator grow in magnitude for large inputs.

Solution

1. In the displayed interval, the plotted curve rises to the left of \(0\), falls to the right of \(0\), and has a horizontal tangent at \(x=0\). 2. The quotient rule gives \(f'(x)=\frac{-4x}{(1+0.5x^2)^2}\). 3. The derivative is zero only at \(x=0\). Its denominator is always positive, so \(f'(x)>0\) for \(x<0\) and \(f'(x)<0\) for \(x>0\). 4. For large \(|x|\), the denominator grows on the order of \(x^4\) while the numerator grows on the order of \(x\). Thus, \(f'(x)\to0\) as \(x\to\pm\infty\). 5. The derivative's signs and zero agree with the rise, fall, and flat point read from the graph.

Answer

In the displayed graph, \(f\) rises to the left of \(0\), falls to the right, and is flat at \(0\). The derivative formula confirms for all real \(x\) that \(f'>0\) for \(x<0\), \(f'<0\) for \(x>0\), and \(f'(0)=0\). Also, \(f'(x)\to0\) as \(x\to\pm\infty\).
Functions and their derivative graphs 151
The figure shows a function \(f\) (solid blue) and a function \(g\) (dashed orange). One graph is the derivative of the other. a) Use local extrema and zeros to explain why \(g\) must be the derivative of \(f\), not the other way around. b) Check the relationship at \(x = 0\). Estimate the slope of \(f\) there and compare it with \(g(0)\).
Figure for problem 534218

Hints

- Match local extrema of one graph with zeros of the other. - Compare monotonicity with the sign of the possible derivative. - Read the tangent slope at \(x = 0\) and compare it with the other graph's value there.

Solution

1. The graph of \(f\) has a local maximum at \(x = -2\) and a local minimum at \(x = 2\). The graph of \(g\) is zero at those same values. Also, \(g\) is negative where \(f\) decreases and positive where \(f\) increases. Therefore, \(g = f'\). 2. The reverse assignment is impossible because \(g\) is quadratic, so its derivative would be linear, while \(f\) is cubic. 3. At \(x = 0\), the slope of \(f\) is approximately \(-1.2\). The graph of \(g\) gives \(g(0) \approx -1.2\), confirming the derivative relationship.

Answer

a) \(g = f'\). Its zeros match the local extrema of \(f\), and its sign matches where \(f\) increases or decreases. b) The slope of \(f\) at \(x = 0\) is approximately \(-1.2\), and \(g(0) \approx -1.2\).
Functions and their derivative graphs 152
The graph of \(f\) is shown. Decide which statements about \(f^{\prime}\) are true. (1) On \((-2,2)\), the graph of \(f^{\prime}\) lies above the x-axis. (2) \(f^{\prime}(-2)=f^{\prime}(2)\). (3) \(f^{\prime}(0)<f^{\prime}(4)\). (4) The derivative \(f^{\prime}\) has a local extremum at \(x=0\).
Figure for problem 534219

Hints

- Use the monotonicity of \(f\) to determine the sign of \(f^{\prime}\). - Horizontal tangent lines give zeros of the derivative. - Compare a negative slope with a positive slope. - An inflection point of \(f\) corresponds to a local extremum of \(f^{\prime}\).

Solution

1. Statement (1) is false. The function \(f\) is decreasing on \((-2,2)\), so \(f^{\prime}(x)<0\) and its graph lies below the x-axis. 2. Statement (2) is true. The graph has horizontal tangent lines at the local maximum \(x=-2\) and the local minimum \(x=2\). Therefore, \(f^{\prime}(-2)=0=f^{\prime}(2)\). 3. Statement (3) is true. At \(x=0\), the graph is decreasing, so \(f^{\prime}(0)<0\). At \(x=4\), it is increasing, so \(f^{\prime}(4)>0\). Thus, \(f^{\prime}(0)<f^{\prime}(4)\). 4. Statement (4) is true. The graph of \(f\) has an inflection point at \(x=0\). Therefore, its slope function \(f^{\prime}\) has a local extremum there.

Answer

(1) False (2) True (3) True (4) True
Functions and their derivative graphs 153
The graph of \(f(x)=\frac{2x}{x^2+1}\) is shown. Which statements about \(f'\) are correct? Explain what the graph suggests, then verify each claim with the derivative formula. (1) For every displayed \(x\) with \(1\le|x|\le4\), \(f'(x)\le0\). (2) \(f'(0)=1\). (3) \(f'(2)<f'(3)\). (4) The derivative has a zero at \(x=1\).
Figure for problem 534220

Hints

- Differentiating the given formula lets you check an entire interval, not just a finite sketch. - Compare the signs of the numerator and denominator of \(f'\). - When comparing negative slopes, check their order on the number line.

Solution

1. The quotient rule gives \(f'(x)=\frac{2(1-x^2)}{(x^2+1)^2}\). 2. Statement (1) is true. The graph falls outward from its two turning points, and the derivative numerator is nonpositive when \(|x|\ge1\), including the stated displayed interval. 3. Statement (2) is false: \(f'(0)=2\), not \(1\). 4. Statement (3) is true: \(f'(2)=-\frac{6}{25}\) and \(f'(3)=-\frac{4}{25}\), so the first is smaller. 5. Statement (4) is true: the graph has a smooth maximum at \(1\), where \(f'(1)=0\).

Answer

(1) True; the graph decreases on the displayed outer intervals. (2) False; \(f'(0)=2\). (3) True; \(f'(2)=-\frac{6}{25}<-\frac{4}{25}=f'(3)\). (4) True; the graph has a smooth maximum at \(x=1\).
Functions and their derivative graphs 154
The graph of a cubic polynomial \(f\) is shown. Decide which statements are true. (1) The derivative \(f^{\prime}\) has exactly two zeros in the displayed interval. (2) On \((-1,3)\), the graph of \(f^{\prime}\) lies above the x-axis. (3) The derivative \(f^{\prime}\) has a local extremum at \(x=1\). (4) \(\lim_{x\to\infty}f^{\prime}(x)=\infty\).
Figure for problem 534227

Hints

- Local extrema of \(f\) give zeros of \(f^{\prime}\). - Use increasing and decreasing intervals to determine the derivative sign. - An inflection point of \(f\) corresponds to a local extremum of \(f^{\prime}\). - Consider the degree and leading coefficient of the derivative.

Solution

1. Statement (1) is true. The graph has a local maximum at \(x=-1\) and a local minimum at \(x=3\), so \(f^{\prime}\) has zeros at those two inputs. 2. Statement (2) is false. The graph of \(f\) is decreasing on \((-1,3)\), so \(f^{\prime}(x)<0\) and the derivative graph lies below the x-axis. 3. Statement (3) is true. The graph of \(f\) has an inflection point at \(x=1\), so \(f^{\prime}\) has a local extremum there. 4. Statement (4) is true. The cubic has a positive leading coefficient, so its derivative is an upward-opening quadratic. Therefore, \(f^{\prime}(x)\to\infty\) as \(x\to\infty\).

Answer

(1) True (2) False (3) True (4) True
Functions and their derivative graphs 155
The graph of \(f\) is shown. Which expression represents \(f^{\prime}\)? Justify your choice. A) \(f^{\prime}(x)=-0.3x^2+0.6x+0.9\) B) \(f^{\prime}(x)=0.3x^2-0.6x-0.9\) C) \(f^{\prime}(x)=-0.6x+0.6\) D) \(f^{\prime}(x)=-0.1x^2+0.3x+0.9\)
Figure for problem 534229

Hints

- Find the local extrema of \(f\). - The derivative must be zero at those inputs. - Use the increasing and decreasing intervals to determine the sign of the derivative. - The derivative of a cubic polynomial is quadratic.

Solution

1. The graph has a local minimum at \(x=-1\) and a local maximum at \(x=3\). Therefore, \(f^{\prime}\) must have zeros at \(x=-1\) and \(x=3\). 2. Options A and B have those two zeros. Option C is linear and has only one zero, and option D has different zeros. 3. Between \(-1\) and \(3\), the graph of \(f\) is increasing, so \(f^{\prime}(x)>0\) there. 4. At \(x=0\), option A gives \(0.9>0\), while option B gives \(-0.9<0\). Therefore, option A has the correct sign pattern.

Answer

A) \(f^{\prime}(x)=-0.3x^2+0.6x+0.9\)
Functions and their derivative graphs 156
The graph of \(f\) is shown. Decide whether each statement about \(f^{\prime}\) is true or false. (1) \(f^{\prime}(-1)>0\). (2) \(f^{\prime}(0)=0\). (3) On \([0,1.5]\), the graph of \(f^{\prime}\) lies above the x-axis. (4) The derivative has a zero near \(x=1.7\). (5) The slope of \(f\) at \(x=2\) is negative. (6) The derivative \(f^{\prime}\) has at least three zeros.
Figure for problem 534238

Hints

- The derivative sign indicates whether the original graph is increasing or decreasing. - Horizontal tangent lines give zeros of the derivative. - Check the entire stated interval, including its endpoints. - Count all local extrema of the original graph.

Solution

1. Statement (1) is true. The graph is increasing at \(x=-1\), so \(f^{\prime}(-1)>0\). 2. Statement (2) is true. The graph has a local maximum at \(x=0\), so \(f^{\prime}(0)=0\). 3. Statement (3) is false. At \(x=0\), the derivative equals zero, and for \(0<x\le1.5\), the graph of \(f\) is decreasing, so \(f^{\prime}(x)<0\). 4. Statement (4) is true. The graph has a local minimum near \(x=1.73\), so \(f^{\prime}\) has a zero there. 5. Statement (5) is false. The graph is increasing at \(x=2\), so \(f^{\prime}(2)>0\). 6. Statement (6) is true. The graph has three horizontal tangent lines, so \(f^{\prime}\) has three zeros.

Answer

(1) True (2) True (3) False (4) True (5) False (6) True
Functions and their derivative graphs 157
The graph of \(g\) is shown. a) At what inputs is \(g^{\prime}(x)=0\)? b) Is \(g^{\prime}(x)\) positive or negative on \((0,2)\)? Justify your answer using the graph of \(g\). c) Which value is greater, \(g^{\prime}(-1)\) or \(g^{\prime}(1)\)? Briefly explain.
Figure for problem 534239

Hints

- Local extrema of \(g\) give zeros of \(g^{\prime}\). - The derivative is negative where the function is decreasing. - Compare the signs of the tangent slopes at \(x=-1\) and \(x=1\).

Solution

1. The derivative is zero where the graph has horizontal tangent lines. The graph has a local maximum at \(x=0\) and a local minimum at \(x=2\). Thus, \(g^{\prime}(0)=0\) and \(g^{\prime}(2)=0\). 2. The graph of \(g\) is decreasing on \((0,2)\), so \(g^{\prime}(x)<0\) throughout that interval. 3. At \(x=-1\), the graph is increasing, so \(g^{\prime}(-1)>0\). At \(x=1\), it is decreasing, so \(g^{\prime}(1)<0\). Therefore, \(g^{\prime}(-1)>g^{\prime}(1)\).

Answer

a) \(x=0\) and \(x=2\) b) Negative: \(g^{\prime}(x)<0\) on \((0,2)\). c) \(g^{\prime}(-1)>g^{\prime}(1)\).
Functions and their derivative graphs 158
The graph of \(h\) is shown. Decide whether each statement about \(h^{\prime}\) is true or false, and justify your decision. (1) \(h^{\prime}(-2)=0\). (2) \(h^{\prime}(0)>0\). (3) On \([-1,1]\), the graph of \(h^{\prime}\) lies below the x-axis. (4) In the displayed interval, the derivative \(h^{\prime}\) has exactly two zeros.
Figure for problem 534247

Hints

- Look at the tangent direction at each specified input. - Compare the graph's height as you move from left to right. - Check whether the tangent is horizontal at any other points in the displayed interval.

Solution

1. Statement (1) is true. The graph has a local maximum at \(x=-2\), so its tangent is horizontal. 2. Statement (2) is false. The graph is decreasing at \(x=0\), so the tangent slope there is negative. 3. Statement (3) is true. The graph is decreasing throughout \([-1,1]\), and its tangents have negative slopes there. 4. Statement (4) is true. The displayed graph has horizontal tangents at \(x=-2\) and \(x=2\), and nowhere else in the displayed interval.

Answer

(1) True; the tangent is horizontal at the high point \(x=-2\). (2) False; \(h\) falls at \(x=0\), so \(h'(0)<0\). (3) True; the curve falls on \([-1,1]\), so its tangent slopes are negative there. (4) True; the horizontal tangents in the displayed interval occur at \(x=-2\) and \(x=2\).
Functions and their derivative graphs 159
The graphs of two polynomial functions, \(f_1\) and \(f_2\), are shown along with two derivative graphs. a) Match each function graph, (1) and (2), with its derivative graph, (A) or (B). b) Justify each match using critical points and intervals where the function is increasing or decreasing.
Figure for problem 534248

Hints

- At a smooth local maximum or minimum, the derivative is zero. - Compare where each function increases or decreases with where each derivative is positive or negative. - A quadratic function has a linear derivative, while a cubic function has a quadratic derivative.

Solution

1. Graph (1) is a downward-opening parabola with a local maximum at \(x=2\). Its derivative must be positive before \(x=2\), zero at \(x=2\), and negative after \(x=2\). Graph (B), the decreasing line \(y=-x+2\), has this sign pattern. Therefore, (1) matches (B). 2. Graph (2) is a cubic with a local maximum at \(x=-2\) and a local minimum at \(x=2\). Its derivative must be zero at \(x=-2\) and \(x=2\), positive outside those values, and negative between them. Graph (A), the upward-opening parabola \(y=0.75x^2-3\), has this sign pattern. Therefore, (2) matches (A).

Answer

a) (1) matches (B); (2) matches (A). b) The critical point of (1) at \(x=2\) matches the zero and sign change of (B). The critical points of (2) at \(x=-2\) and \(x=2\) match the zeros and sign changes of (A).
Functions and their derivative graphs 160
The graph of \(g\) is shown with three candidate derivative graphs, A, B, and C. Which graph represents \(g^{\prime}\)? Explain why the other two graphs cannot be correct.
Figure for problem 534249

Hints

- Count all horizontal tangent lines on the graph of \(g\). - Match their x-coordinates to zeros of the candidates. - Check whether \(g\) is increasing or decreasing on each interval. - Eliminate any candidate with the wrong sign.

Solution

1. The fourth-degree graph of \(g\) has local minima at \(x=-2\) and \(x=2\) and a local maximum at \(x=0\). Therefore, \(g^{\prime}\) must have zeros at \(x=-2\), \(x=0\), and \(x=2\). 2. Graph A has only two zeros, so it cannot represent \(g^{\prime}\). 3. Graph C has three zeros, but they occur at different inputs. Its sign pattern also does not match: for \(x<-2\), the graph of \(g\) is decreasing, so \(g^{\prime}(x)\) must be negative. 4. Graph B has the required zeros and sign pattern. Therefore, graph B represents \(g^{\prime}\).

Answer

Graph B represents \(g^{\prime}\). Graph A has too few zeros, and graph C has zeros at the wrong inputs and the wrong sign pattern.
Functions and their derivative graphs 161
The graph shown is the graph of \(f'\), the derivative of a function \(f\). Determine whether each statement is true or false. 1. The function \(f\) is strictly increasing on \([-3, 0]\). 2. The function \(f\) has a local minimum at \(x=0\). 3. The graph of \(f\) is concave down throughout \([1, 3]\). 4. The function \(f\) has exactly two inflection points in the displayed interval.
Figure for problem 534262

Hints

- Use the sign of \(f'\) to determine where \(f\) increases or decreases. - At a zero of \(f'\), check how the sign changes to classify a local extremum of \(f\). - Use whether \(f'\) is increasing or decreasing to determine the concavity of \(f\). - Inflection points of \(f\) correspond to local extrema of \(f'\).

Solution

1. True. On \((-3, 0)\), the graph of \(f'\) is above the \(x\)-axis, so \(f\) is strictly increasing on \([-3, 0]\). 2. False. At \(x=0\), \(f'\) changes from positive to negative, so \(f\) has a local maximum there. 3. False. The graph of \(f'\) decreases at first on \([1, 3]\), reaches a local minimum between \(x=2\) and \(x=3\), and then increases. Therefore, \(f\) is not concave down throughout the interval. 4. True. Inflection points of \(f\) occur where \(f'\) changes from increasing to decreasing or from decreasing to increasing. The graph of \(f'\) has one local maximum and one local minimum in the displayed interval, so \(f\) has exactly two inflection points there.

Answer

1. True 2. False 3. False 4. True
Functions and their derivative graphs 162
The graph shown is the graph of \(f'\), the derivative of a function \(f\). a) Find the \(x\)-coordinates of all local extrema of \(f\). Classify each as a local maximum or local minimum, and justify your answer. b) At what \(x\)-value does \(f\) have a stationary inflection point? Justify your answer using the sign behavior of \(f'\).
Figure for problem 534271

Hints

- Zeros of \(f'\) indicate points where \(f\) has a horizontal tangent. - A sign change in \(f'\) determines whether a local maximum or minimum occurs. - Consider what happens when \(f'\) equals zero but keeps the same sign on both sides. - Make sure you are interpreting the graph of the derivative, not the graph of \(f\).

Solution

1. Local extrema occur at zeros of \(f'\) where the sign changes. At \(x=-3\), \(f'\) changes from negative to positive, so \(f\) has a local minimum. At \(x=1\), \(f'\) changes from positive to negative, so \(f\) has a local maximum. 2. At \(x=4\), \(f'(4)=0\), but \(f'\) is negative on both sides of \(x=4\). Thus, \(f\) continues decreasing and does not have a local extremum. Because \(f'\) changes from increasing to decreasing at \(x=4\), the concavity of \(f\) changes there. Therefore, \(f\) has a stationary inflection point at \(x=4\).

Answer

a) Local minimum at \(x=-3\); local maximum at \(x=1\). b) A stationary inflection point occurs at \(x=4\).
Functions and their derivative graphs 163
The graph shown is the graph of \(f'\), the derivative of a function \(f\). a) Does \(f\) have a local extremum at \(x=2\)? Justify your answer. b) Find the \(x\)-coordinate of the local extremum of \(f\), and classify it. c) At what \(x\)-value does \(f\) have a stationary inflection point? Justify your answer.
Figure for problem 534273

Hints

- A zero of the derivative alone does not guarantee a local extremum. - Check whether the graph of \(f'\) crosses or only touches the \(x\)-axis. - A stationary inflection point has a horizontal tangent but is not a local extremum.

Solution

1. Although \(f'(2)=0\), the derivative does not change sign at \(x=2\). Therefore, \(f\) does not have a local extremum there. 2. At \(x=-1\), \(f'\) changes from positive to negative, so \(f\) has a local maximum at \(x=-1\). 3. At \(x=2\), \(f'\) has a local maximum with value \(0\). Thus, \(f'(2)=0\) without a sign change, while \(f'\) changes from increasing to decreasing. Therefore, the concavity of \(f\) changes and \(f\) has a stationary inflection point at \(x=2\).

Answer

a) No. The derivative does not change sign at \(x=2\). b) Local maximum at \(x=-1\). c) A stationary inflection point occurs at \(x=2\).
Functions and their derivative graphs 164
The graph shown is the first derivative \(f'\) of a function \(f\). a) Find the x-coordinates of the inflection points of \(f\). Explain your reasoning. b) State the intervals in the displayed domain where \(f\) is concave up and concave down.
Figure for problem 534275

Hints

- The slope of \(f'\) represents \(f''\). - The x-coordinates of inflection points of \(f\) occur where \(f'\) changes from increasing to decreasing or vice versa. - Where is the graph of \(f'\) increasing? - Where is the graph of \(f'\) decreasing?

Solution

1. The graph of \(f'\) has local extrema at \(x=-2\) and \(x=2\), so \(f\) has inflection points at those x-values. 2. On the displayed domain \([-4.5,4.5]\), \(f'\) is increasing on \((-2,2)\). Therefore, \(f\) is concave up on \((-2,2)\). 3. The graph of \(f'\) is decreasing on \([-4.5,-2)\) and \((2,4.5]\). Therefore, \(f\) is concave down on those intervals.

Answer

a) \(x=-2\) and \(x=2\) b) Concave up on \((-2,2)\); concave down on \([-4.5,-2)\) and \((2,4.5]\).
Functions and their derivative graphs 165
The graph of \(f\) has seven marked inputs, \(x_1\) through \(x_7\). Identify the marked input or inputs where: a) \(f(x)\) is greatest and where it is least, b) \(f^{\prime}(x)\) is greatest and where it is least, and c) the graph is concave down, so \(f^{\prime\prime}(x)<0\).
Figure for problem 534292

Hints

- Function values are compared by the vertical positions of the marked points. - Derivative values are compared by tangent-line steepness and direction. - A steep downward tangent has a large negative derivative. - Concave down means tangent slopes decrease as \(x\) increases.

Solution

1. Compare the heights of the marked points. The greatest marked function values occur at \(x_1\) and \(x_7\). The least marked values occur at the local minima \(x_2\) and \(x_6\). 2. The derivative is greatest where the graph rises most steeply, at \(x_7\). It is least where the graph falls most steeply, at \(x_1\). 3. The graph is concave down near its local maximum, which is the marked point \(x_4\). The points \(x_3\) and \(x_5\) are approximately inflection points, while the other marked points are in concave-up regions.

Answer

a) Greatest at \(x_1\) and \(x_7\); least at \(x_2\) and \(x_6\) b) Greatest at \(x_7\); least at \(x_1\) c) Concave down at \(x_4\)
Functions and their derivative graphs 166
The graph of \(g\) has marked inputs \(x_1\) through \(x_6\). Use the graph to determine: a) where \(g(x)\) reaches its maximum in the displayed interval, b) where the instantaneous rate of change \(g^{\prime}(x)\) is smallest, and c) where the graph has an inflection point, so \(g^{\prime\prime}(x)=0\).
Figure for problem 534293

Hints

- The maximum occurs at the highest marked point. - The smallest derivative occurs where the graph has its steepest downward tangent. - An inflection point is where the graph changes concavity.

Solution

1. The highest marked point is \(x_3\), so \(g(x)\) reaches its maximum there. 2. The derivative is smallest where the graph falls most steeply. Among the marked points on the decreasing part of the graph, this occurs at \(x_5\). 3. At \(x_5\), the graph changes from concave down to concave up. Therefore, \(x_5\) is an inflection point and \(g^{\prime\prime}(x_5)=0\).

Answer

a) \(x_3\) b) \(x_5\) c) \(x_5\)
Functions and their derivative graphs 167
For each marked point \(A\), \(B\), and \(C\), determine whether \(f(x)\), \(f'(x)\), and \(f''(x)\) are positive, negative, or zero.
Figure for problem 534297

Hints

- Use each point’s position relative to the x-axis for the sign of \(f(x)\). - Use whether the graph is increasing, decreasing, or horizontal for the sign of \(f'(x)\). - Use concavity for the sign of \(f''(x)\). - At an inflection point, the concavity changes.

Solution

1. At \(A=(0, 0)\), the point lies on the x-axis, the graph is increasing, and it is concave down. Therefore, \(f(0)=0\), \(f'(0)>0\), and \(f''(0)<0\). 2. At \(B\), the graph has a local maximum above the x-axis and is concave down. Therefore, \(f(2)>0\), \(f'(2)=0\), and \(f''(2)<0\). 3. At \(C\), the graph is above the x-axis and decreasing. It changes concavity there. Therefore, \(f(4)>0\), \(f'(4)<0\), and \(f''(4)=0\).

Answer

Point \(A\): \(f(x)=0\), \(f'(x)>0\), \(f''(x)<0\) Point \(B\): \(f(x)>0\), \(f'(x)=0\), \(f''(x)<0\) Point \(C\): \(f(x)>0\), \(f'(x)<0\), \(f''(x)=0\)
Functions and their derivative graphs 168
The graph shown is the graph of \(f'\), the derivative of a polynomial function \(f\). Determine whether each statement is true or false, and briefly justify your answer. a) The function \(f\) is strictly decreasing on \([1, 3]\). b) The function \(f\) has a local minimum at \(x=1\). c) The graph of \(f\) is concave up throughout \([-1, 1]\). d) The function \(f\) has exactly two inflection points in the displayed interval.
Figure for problem 534312

Hints

- Use the sign of \(f'\) to determine where \(f\) increases or decreases. - Check the direction of the sign change in \(f'\) at \(x=1\). - The graph of \(f\) is concave up where \(f'\) is increasing. - Inflection points of \(f\) correspond to local extrema of \(f'\).

Solution

1. Statement a) is true. The derivative is negative on \((1, 3)\), so \(f\) is strictly decreasing on \([1, 3]\). 2. Statement b) is false. At \(x=1\), \(f'\) changes from positive to negative, so \(f\) has a local maximum. 3. Statement c) is false. The graph of \(f'\) has a local maximum between \(x=-1\) and \(x=0\). Thus, \(f'\) changes from increasing to decreasing within \([-1, 1]\), so the concavity of \(f\) changes there. 4. Statement d) is true. Inflection points of \(f\) occur where \(f'\) changes between increasing and decreasing. The graph of \(f'\) has exactly two local extrema in the displayed interval.

Answer

a) True b) False c) False d) True
Functions and their derivative graphs 169
The graphs of \(f'\) and \(f''\) are shown for a polynomial function \(f\). a) Find all x-coordinates of inflection points of \(f\) in the displayed interval. Use this example to explain the difference between a necessary condition and a sufficient condition for an inflection point. b) Find the intervals where the graph of \(f\) is concave down. c) Use the graphs to explain why \(f\) has an inflection point with locally maximum slope at \(x=1.5\).
Figure for problem 534319

Hints

- Which derivative determines the concavity of a function? - For a polynomial, a necessary condition must hold; a sufficient condition guarantees the conclusion. - How are local extrema of \(f'\) related to the slope of \(f\)? - Use the sign of \(f''\) to determine concavity.

Solution

1. Because \(f\) is a polynomial, a necessary condition for an inflection point is \(f''(x)=0\). The graph of \(f''\) has zeros at \(x=-0.5\), \(x=1.5\), and \(x=3.5\). At each zero, \(f''\) changes sign, which is sufficient for an inflection point. Therefore, all three values are x-coordinates of inflection points. 2. The graph of \(f\) is concave down where \(f''(x)<0\). In the displayed interval, this occurs on \([-1.5,-0.5)\) and \((1.5,3.5)\). 3. At \(x=1.5\), \(f''\) changes from positive to negative. Therefore, \(f'\) changes from increasing to decreasing and has a local maximum. Since \(f'\) gives the slope of \(f\), the slope of \(f\) is locally greatest there.

Answer

a) \(x=-0.5\), \(x=1.5\), and \(x=3.5\). For this polynomial, \(f''(x)=0\) is necessary, while a sign change in \(f''\) is sufficient. b) \([-1.5,-0.5)\) and \((1.5,3.5)\) c) At \(x=1.5\), \(f''\) changes from positive to negative, so \(f'\) has a local maximum and the slope of \(f\) is locally greatest.
Functions and their derivative graphs 170
Let \(f(x)=x^4-2x^2\). The graph shown represents a function \(g\). Give three different reasons why the graph of \(g\) cannot be the graph of \(f'\).
Figure for problem 534330

Hints

- Determine the degree of \(f'\). - Compare the symmetry of \(f\), \(f'\), and the displayed graph. - Compare the derivative value at \(x=0\) with the graph. - Consider how the end behavior of a cubic differs from that of a parabola.

Solution

1. Differentiate: \(f'(x)=4x^3-4x\). 2. Degree: The derivative of a fourth-degree polynomial is a third-degree polynomial, but \(g\) is a parabola, so it is quadratic. 3. Symmetry: The function \(f\) is even, so \(f'\) must be odd and symmetric about the origin. The graph of \(g\) is symmetric about the y-axis. 4. Value at the origin: Since \(f'(0)=0\), the graph of \(f'\) must pass through the origin. The graph shown has \(g(0)=-2\).

Answer

Three valid reasons are: \(f'\) must be cubic, but \(g\) is quadratic; \(f'\) must be odd, but \(g\) is even; and \(f'(0)=0\), but \(g(0)=-2\).
Functions and their derivative graphs 171
Consider the function \(f(x)=x^4-4x^3\). The graph shown represents a function \(g\). Give three different reasons why \(g\) cannot be the graph of \(f'\).
Figure for problem 534335

Hints

- Determine the degree of \(f'\). - Factor \(f'\) and examine the multiplicity of its zero at \(x=0\). - Compare the signs of \(f'\) and \(g\) for negative \(x\)-values. - Relate the zeros of a derivative to the horizontal tangents of the original function.

Solution

1. Differentiate and factor: \(f'(x)=4x^3-12x^2=4x^2(x-3)\). 2. Degree: The derivative \(f'\) is cubic, but the graph of \(g\) is a parabola, so \(g\) is quadratic. 3. Behavior at \(x=0\): The derivative \(f'\) has a double zero at \(x=0\) and does not change sign there. The graph of \(g\) crosses the \(x\)-axis at \(x=0\), changing from positive to negative. 4. Sign for negative inputs: For \(x<0\), \(4x^2>0\) and \(x-3<0\), so \(f'(x)<0\). The displayed graph has \(g(x)>0\) for \(x<0\).

Answer

Three valid reasons are: \(f'\) must be cubic, but \(g\) is quadratic; \(f'\) has a double zero and no sign change at \(x=0\), but \(g\) changes sign there; and \(f'(x)<0\) for every \(x<0\), but the graph shows \(g(x)>0\) for \(x<0\).
Functions and their derivative graphs 172
The graph of the derivative \(f'\) is shown. Determine whether each statement about \(f\) is true or false, and justify your answer. 1. The graph of \(f\) is concave up on \((-1,3)\). 2. The graph of \(f\) has an inflection point at \(x=0\). 3. In the displayed interval, the graph of \(f\) is concave down for \(3<x\le5.5\).
Figure for problem 534353

Hints

- When \(f'\) is increasing, \(f\) is concave up; when \(f'\) is decreasing, \(f\) is concave down. - The x-coordinates of inflection points of \(f\) occur where \(f'\) changes from increasing to decreasing or vice versa. - Restrict your conclusions to the displayed domain.

Solution

1. True. The graph of \(f'\) is increasing on \((-1,3)\), so \(f''(x)>0\) there. Therefore, \(f\) is concave up on that interval. 2. False. An inflection point of \(f\) occurs where \(f'\) changes from increasing to decreasing or from decreasing to increasing. The graph of \(f'\) has local extrema at \(x=-1\) and \(x=3\), not at \(x=0\). 3. True. The graph of \(f'\) is decreasing for \(3<x\le5.5\), so \(f''(x)<0\) there. Therefore, \(f\) is concave down.

Answer

1. True; \(f'\) is increasing on \((-1,3)\). 2. False; \(f'\) does not have a local extremum at \(x=0\). 3. True; \(f'\) is decreasing for \(3<x\le5.5\).
Functions and their derivative graphs 173
Graphs A, B, and C are possible graphs of \(f^{\prime}\). The function \(f\) is defined for all real numbers and has exactly two local extrema on \([-4,4]\): a local minimum at \(x=-2\) and a local maximum at \(x=2\). Decide which graph represents \(f^{\prime}\). Explain why the other two graphs cannot be correct.
Figure for problem 534354

Hints

- A local extremum of \(f\) corresponds to a zero of \(f^{\prime}\). - At a local minimum, the derivative changes from negative to positive. - At a local maximum, the derivative changes from positive to negative. - Check both the number of zeros and the direction of each sign change.

Solution

1. At the local minimum \(x=-2\), the derivative must be zero and change sign from negative to positive. 2. At the local maximum \(x=2\), the derivative must be zero and change sign from positive to negative. 3. Graph C has only one zero, so it cannot represent the derivative. 4. Graph B has zeros at \(-2\) and \(2\), but its sign changes correspond to a maximum at \(-2\) and a minimum at \(2\), the reverse of the given information. 5. Graph A has zeros at \(-2\) and \(2\), with a negative-to-positive sign change at \(-2\) and a positive-to-negative sign change at \(2\). Therefore, graph A represents \(f^{\prime}\).

Answer

Graph A represents \(f^{\prime}\).
Functions and their derivative graphs 174
The graph of \(N\) models the number of users of a new streaming service during its first \(10\) months. The value \(N(t)\) is measured in millions of users, and \(t\) is measured in months. a) At what time is the number of users increasing most rapidly? b) Interpret line \(g\) in context. c) Describe the graph of \(N^{\prime}\), and explain what it shows about the rate of user growth.
Figure for problem 534362

Hints

- The greatest rate of increase occurs where the graph is steepest. - Interpret a horizontal asymptote as a limiting value in context. - The derivative records the slope of the original graph. - Compare slopes before and after the inflection point.

Solution

1. The user count increases most rapidly where the graph of \(N\) has its greatest slope, at the inflection point of the S-shaped curve. This occurs at \(t=5\) months. 2. Line \(g\) is the horizontal asymptote \(N=12\). In context, it represents a long-term saturation level of \(12\) million users. 3. The derivative \(N^{\prime}\) gives the instantaneous growth rate in millions of users per month. Its graph is bell-shaped, stays positive, and has its maximum at \(t=5\). Thus, the growth rate increases until month \(5\) and then decreases as the user count approaches saturation.

Answer

a) At \(t=5\) months b) Line \(g\) represents a long-term saturation level of \(12\) million users. c) The graph of \(N^{\prime}\) is a positive bell-shaped curve with a maximum at \(t=5\). It represents the instantaneous user-growth rate.
Functions and their derivative graphs 175
The graph shown is the graph of \(f'\), the derivative of a function \(f\). a) Find the \(x\)-coordinates of the local extrema of \(f\), and classify each as a local maximum or local minimum. b) Find the \(x\)-coordinate of the inflection point of \(f\). c) Use the graph of \(f'\) to explain why \(f(0)>f(-1)\).
Figure for problem 534373

Hints

- Use zeros and sign changes of \(f'\) to locate and classify local extrema of \(f\). - An inflection point of \(f\) corresponds to a local extremum of \(f'\). - Use the sign of \(f'\) on \([-1, 0]\) to compare the two function values. - Check whether the derivative graph is above or below the \(x\)-axis.

Solution

1. The zeros of \(f'\) are \(x=-4\) and \(x=2\). At \(x=-4\), \(f'\) changes from negative to positive, so \(f\) has a local minimum. At \(x=2\), \(f'\) changes from positive to negative, so \(f\) has a local maximum. 2. An inflection point of \(f\) occurs where \(f'\) changes from increasing to decreasing. The graph of \(f'\) has its vertex at \(x=-1\), so \(f\) has an inflection point at \(x=-1\). 3. On \([-1, 0]\), the graph of \(f'\) is above the \(x\)-axis, so \(f\) is strictly increasing. Since \(0>-1\), it follows that \(f(0)>f(-1)\).

Answer

a) Local minimum at \(x=-4\); local maximum at \(x=2\). b) The inflection point occurs at \(x=-1\). c) Since \(f'(x)>0\) on \([-1, 0]\), \(f\) is strictly increasing there, so \(f(0)>f(-1)\).
Functions and their derivative graphs 176
The graph of the derivative \(f'\) of a polynomial function \(f\) is shown. a) Estimate the x-coordinates of the inflection points of \(f\). b) On what interval is the graph of \(f\) concave down? Justify your answer using the behavior of \(f'\). c) Explain why \(f(-1)>f(-2)\).
Figure for problem 534374

Hints

- Which special points on the derivative graph identify x-coordinates of inflection points of the original function? - What must the derivative graph do when the original function is concave down? - Is the derivative positive or negative between \(x=-2\) and \(x=-1\)? - Use the sign of \(f'\) to determine whether \(f\) is increasing or decreasing.

Solution

1. The x-coordinates of inflection points of \(f\) occur where \(f'\) has local extrema. From the graph, these occur at approximately \(x=-2.3\) and \(x=2.3\). 2. The graph of \(f\) is concave down where \(f'\) is decreasing. The derivative graph decreases between its local maximum and local minimum, so \(f\) is concave down on approximately \((-2.3,2.3)\). 3. On \([-2,-1]\), the graph of \(f'\) lies above the x-axis, so \(f'(x)>0\). Therefore, \(f\) is increasing on this interval, which gives \(f(-1)>f(-2)\).

Answer

a) Approximately \(x=-2.3\) and \(x=2.3\) b) Approximately \((-2.3,2.3)\), because \(f'\) is decreasing there. c) Since \(f'(x)>0\) on \([-2,-1]\), \(f\) is increasing and \(f(-1)>f(-2)\).
Functions and their derivative graphs 177
Panel a) shows a function \(k\). Panels b), c), and d) show three possible graphs of \(k^{\prime}\). Which panel represents \(k^{\prime}\)? Justify your choice by comparing geometric features of the function and derivative graphs.
Figure for problem 534392

Hints

- Horizontal tangent lines on \(k\) give zeros of \(k^{\prime}\). - Determine where \(k\) is increasing or decreasing. - The derivative of a cubic polynomial is quadratic. - Check the sign of each candidate between the two zeros.

Solution

1. The graph of \(k\) has a local maximum at \(x=0\) and a local minimum at \(x=2\). Therefore, \(k^{\prime}\) must have zeros at \(x=0\) and \(x=2\). 2. Panel d) is a line with only one zero. Also, the derivative of a cubic function must be quadratic, so panel d) cannot be correct. 3. Panels b) and c) are parabolas with zeros at \(x=0\) and \(x=2\). 4. The graph of \(k\) is decreasing for \(0<x<2\), so \(k^{\prime}(x)<0\) on that interval. 5. Panel b) lies below the x-axis between the zeros, while panel c) lies above it. Therefore, panel b) represents \(k^{\prime}\).

Answer

Panel b) represents \(k^{\prime}\).
Functions and their derivative graphs 178
The graph of \(f'\) is shown. Determine whether each statement about \(f\) is true or false. Justify each answer. (1) \(f\) is strictly increasing on \([-3,-1]\). (2) \(f\) has a local extremum at \(x\approx0.8\). (3) \(f\) has a local minimum at \(x=-3\). (4) \(f(2)>f(-1)\).
Figure for problem 534415

Hints

- Use the sign of \(f'\) for monotonicity and extrema. - A local extremum of the derivative need not be a local extremum of the original function. - Compare \(f(2)\) and \(f(-1)\) from whether \(f\) rises or falls between those x-values.

Solution

1. True. On \((-3,-1)\), \(f'>0\), so \(f\) is strictly increasing. 2. False. Near \(x\approx0.8\), the graph of \(f'\) has a local minimum but is not zero. Thus \(f'\ne0\), so \(f\) has no local extremum there. Instead, the change from decreasing to increasing in \(f'\) gives an inflection point of \(f\). 3. True. At \(x=-3\), \(f'\) changes from negative to positive, so \(f\) has a local minimum. 4. False. Since \(f'(x)<0\) on \((-1,2)\), \(f\) is strictly decreasing there, so \(f(2)<f(-1)\).

Answer

(1) True. (2) False. (3) True. (4) False.
Functions and their derivative graphs 179
The graph of a function \(g\), where \(g=G^{\prime}\), is shown. Also, \(G(0)=1\). a) Approximately at what x-values does \(G\) have inflection points? Justify your answer using the graph of \(g\). b) Find an equation of the tangent line to \(G\) at \(x=0\). c) Describe the qualitative shape of \(G\) on \([-2,2]\), including its local extrema and the given point.
Figure for problem 534424

Hints

- Inflection points of \(G\) correspond to local extrema of \(G^{\prime}\). - The value \(g(0)\) is the slope of the tangent to \(G\) at \(x=0\). - Use the sign changes of \(g\) to classify the local extrema of \(G\).

Solution

1. Inflection points of \(G\) occur where \(g=G^{\prime}\) changes from increasing to decreasing or vice versa. The graph of \(g\) has local extrema at approximately \(x=-1.2\) and \(x=1.2\). Therefore, those are the approximate inflection-point x-values of \(G\). 2. The tangent slope is \(G^{\prime}(0)=g(0)=0\), and the point is \((0,1)\). Thus, the tangent line is \(y=1\). 3. The derivative \(g\) changes from negative to positive at \(x=-2\), so \(G\) has a local minimum there. It changes from positive to negative at \(x=0\), so \(G\) has a local maximum at \((0,1)\). It changes from negative to positive at \(x=2\), so \(G\) has another local minimum there. Since \(g\) is odd and \(G(0)=1\), the graph of \(G\) is symmetric about the y-axis.

Answer

a) Approximately \(x=-1.2\) and \(x=1.2\) b) \(y=1\) c) Local minima at \(x=-2\) and \(x=2\), and a local maximum at \((0,1)\); the graph is symmetric about the y-axis.
Functions and their derivative graphs 180
The blue graphs represent functions \(f\) and \(g\). Among the four red graphs, (1) through (4), are the derivative graphs \(f'\) and \(g'\). Match each function with its derivative graph. Justify your choices using features such as critical points, zeros, and increasing or decreasing behavior.
Figure for problem 534425

Hints

- Find where each function has a horizontal tangent. - Compare where each function increases or decreases with the sign of each possible derivative. - The derivative of a quadratic function is linear. - The derivative of a cubic function is quadratic.

Solution

1. The graph of \(f\) is an upward-opening parabola with vertex at \(x=2\). Therefore, \(f'\) must be zero at \(x=2\), negative for \(x<2\), and positive for \(x>2\). The linear graph (1) has this behavior, so \(f'\) is graph (1). 2. The graph of \(g\) has a local maximum to the left of \(x=0\) and a local minimum between \(x=3\) and \(x=4\). Its derivative must be zero at those two \(x\)-coordinates and negative between them. The upward-opening parabola (2) has this behavior, so \(g'\) is graph (2).

Answer

Graph (1) represents \(f'\), and graph (2) represents \(g'\).
Functions and their derivative graphs 181
The graph of \(f'\) is shown on \([-2,4]\). a) Use the zeros and vertex of the graph to find an equation for \(f'(x)\). b) Determine the open intervals in the displayed domain on which \(f\) is increasing and decreasing. c) Find the \(x\)-coordinates of all local extrema of \(f\) and classify each. d) Find the \(x\)-coordinate of the inflection point of \(f\), and state how the concavity changes there.
Figure for problem 534427

Hints

- Which features of the displayed curve would help determine its equation? - How can you check a proposed derivative formula against more than one visible feature? - What different information about \(f\) comes from the height and from the steepness of its derivative graph?

Solution

1. The graph of \(f'\) has zeros at \(x=-1\) and \(x=3\), so write \(f'(x)=a(x+1)(x-3)\). The vertex is \((1,4)\), so \(4=a(2)(-2)\), giving \(a=-1\). Thus \(f'(x)=-x^2+2x+3\). 2. The derivative is negative on \((-2,-1)\), positive on \((-1,3)\), and negative on \((3,4)\). Therefore, \(f\) decreases on \((-2,-1)\) and \((3,4)\), and increases on \((-1,3)\). 3. At \(x=-1\), \(f'\) changes from negative to positive, so \(f\) has a local minimum. At \(x=3\), \(f'\) changes from positive to negative, so \(f\) has a local maximum. 4. Since \(f''(x)=-2x+2\), \(f''\) changes from positive to negative at \(x=1\). Thus \(f\) is concave up for \(x<1\), concave down for \(x>1\), and has an inflection point at \(x=1\).

Answer

a) \(f'(x)=-x^2+2x+3\) b) Increasing on \((-1,3)\); decreasing on \((-2,-1)\) and \((3,4)\) c) Local minimum at \(x=-1\); local maximum at \(x=3\) d) Inflection point at \(x=1\); concavity changes from up to down.
Functions and their derivative graphs 182
The graph of \(f'\) is shown. a) On what open intervals in the displayed domain is \(f\) increasing and decreasing? b) Find the \(x\)-coordinates of the local extrema of \(f\), and classify each. c) Use the graph's zeros and y-intercept to find an equation for \(f'(x)\). d) Find the \(x\)-coordinates of the inflection points of \(f\). Explain their relationship to the local extrema of \(f'\).
Figure for problem 534455

Hints

- Read the sign of the derivative from its position relative to the x-axis. - Use sign changes at derivative zeros to classify extrema of the original function. - Use the three zeros to write the cubic derivative in factored form. - Inflection points of \(f\) occur where the derivative switches between increasing and decreasing.

Solution

1. The derivative is negative on \((-6,-4)\) and \((1,5)\), and positive on \((-4,1)\) and \((5,7)\). Thus \(f\) decreases on \((-6,-4)\) and \((1,5)\), and increases on \((-4,1)\) and \((5,7)\). 2. At \(x=-4\), \(f'\) changes from negative to positive, so \(f\) has a local minimum. At \(x=1\), it changes from positive to negative, so \(f\) has a local maximum. At \(x=5\), it changes from negative to positive, so \(f\) has a local minimum. 3. The zeros are \(-4\), \(1\), and \(5\), so \(f'(x)=a(x+4)(x-1)(x-5)\). The graph shows \(f'(0)=2\), so \(2=20a\), giving \(a=0.1\). Hence \(f'(x)=0.1(x+4)(x-1)(x-5)\). 4. Inflection points of \(f\) occur where \(f'\) has local extrema. Differentiate: \(f''(x)=0.1(3x^2-4x-19)\). Solving \(f''(x)=0\) gives \(x=\frac{2-\sqrt{61}}{3}\) and \(x=\frac{2+\sqrt{61}}{3}\). The sign of \(f''\) changes at both values, so both are inflection-point x-coordinates.

Answer

a) Increasing on \((-4,1)\) and \((5,7)\); decreasing on \((-6,-4)\) and \((1,5)\) b) Local minima at \(x=-4\) and \(x=5\); local maximum at \(x=1\) c) \(f'(x)=0.1(x+4)(x-1)(x-5)\) d) \(x=\frac{2-\sqrt{61}}{3}\) and \(x=\frac{2+\sqrt{61}}{3}\)
Functions and their derivative graphs 183
The graph of \(f'\) is shown on \([-2,2]\). a) Determine whether \(f\) is increasing or decreasing on \((-2,2)\). b) Identify where \(f\) attains its absolute maximum and absolute minimum on \([-2,2]\). c) Use the zeros and y-intercept of the graph to find an equation for \(f'(x)\). d) Determine the concavity of \(f\) on \((-2,2)\) and give the \(x\)-coordinate of its inflection point.
Figure for problem 534456

Hints

- Use the sign of the derivative throughout the displayed interval. - A function that is strictly decreasing on a closed interval has its largest and smallest values at opposite endpoints. - Use the derivative graph's intercepts to determine its quadratic equation. - Concavity of \(f\) follows from whether \(f'\) is decreasing or increasing.

Solution

1. The graph of \(f'\) is below the x-axis for \(-2<x<2\), so \(f\) is strictly decreasing on \((-2,2)\). 2. Since \(f\) is continuous and strictly decreasing across the closed interval, its absolute maximum occurs at \(x=-2\) and its absolute minimum occurs at \(x=2\). 3. The zeros are \(x=-2\) and \(x=2\), so \(f'(x)=a(x-2)(x+2)\). The graph shows \(f'(0)=-2\), so \(-4a=-2\), giving \(a=\frac12\). Hence \(f'(x)=\frac12x^2-2\). 4. Since \(f''(x)=x\), \(f''<0\) on \((-2,0)\) and \(f''>0\) on \((0,2)\). Thus \(f\) is concave down on \((-2,0)\), concave up on \((0,2)\), and has an inflection point at \(x=0\).

Answer

a) \(f\) is strictly decreasing on \((-2,2)\). b) Absolute maximum at \(x=-2\); absolute minimum at \(x=2\). c) \(f'(x)=\frac12x^2-2\). d) Concave down on \((-2,0)\); concave up on \((0,2)\); inflection point at \(x=0\).
Functions and their derivative graphs 184
The graph of \(f\) is shown. Decide whether each statement is true or false. (1) \(f^{\prime}\) has exactly two zeros. (2) The graph of \(f\) has exactly three inflection points in the displayed interval. (3) \(f^{\prime}(0)>0\). (4) The graph of \(f^{\prime}\) is symmetric about the origin. (5) \(f^{\prime\prime}(1)>0\).
Figure for problem 534484

Hints

- Local extrema of \(f\) give zeros of \(f^{\prime}\). - Inflection points occur where the graph changes concavity. - The first derivative gives tangent slope. - The derivative of an odd function is even. - Concave down corresponds to a negative second derivative.

Solution

1. Statement (1) is true. The graph of \(f\) has a local minimum at \(x=-2\) and a local maximum at \(x=2\), so \(f^{\prime}\) has exactly two zeros. 2. Statement (2) is true. The graph changes concavity near \(x=-3.5\), at \(x=0\), and near \(x=3.5\), giving three inflection points in the displayed interval. 3. Statement (3) is true. The graph is increasing at the origin, so \(f^{\prime}(0)>0\). 4. Statement (4) is false. The graph of \(f\) is symmetric about the origin, so \(f\) is odd and \(f^{\prime}\) is even. Therefore, the derivative graph is symmetric about the y-axis. 5. Statement (5) is false. At \(x=1\), the graph is concave down, so \(f^{\prime\prime}(1)<0\).

Answer

(1) True (2) True (3) True (4) False (5) False
Functions and their derivative graphs 185
The graph shown is the graph of \(f'\), the derivative of a function \(f\). Determine whether each statement is true or false. (1) The graph of \(f\) has a local maximum at \(x=0\). (2) The function \(f\) is strictly decreasing on \([0, 3]\). (3) The function \(f\) has exactly two inflection points in the displayed interval. (4) At \(x=2\), \(f''(2)>0\). (5) The graph of \(f\) has a local maximum at \(x=3\).
Figure for problem 534485

Hints

- Remember that the displayed graph is \(f'\), not \(f\). - Use zeros and sign changes of \(f'\) to classify local extrema of \(f\). - Use the sign of \(f'\) to determine where \(f\) increases or decreases. - Inflection points of \(f\) correspond to local extrema of \(f'\). - The slope of the graph of \(f'\) at a point equals the value of \(f''\) there.

Solution

1. Statement (1) is true. At \(x=0\), \(f'\) changes from positive to negative, so \(f\) has a local maximum. 2. Statement (2) is true. The derivative is negative on \((0, 3)\), so \(f\) is strictly decreasing on \([0, 3]\). 3. Statement (3) is true. Inflection points of \(f\) occur where \(f'\) changes between increasing and decreasing. The graph of \(f'\) has exactly two local extrema in the displayed interval, so \(f\) has exactly two inflection points there. 4. Statement (4) is true. The graph of \(f'\) is increasing at \(x=2\), so its slope is positive and \(f''(2)>0\). 5. Statement (5) is false. At \(x=3\), \(f'\) changes from negative to positive, so \(f\) has a local minimum.

Answer

(1) True (2) True (3) True (4) True (5) False
Functions and their derivative graphs 186
The graph of the derivative \(f^{\prime}\) of a periodic function \(f\) is shown. a) Find all x-values in \([0,6]\) where \(f\) has a local extremum, and classify each. b) Where is \(f\) strictly decreasing on the displayed interval? c) Find all inflection-point x-values of \(f\) in \([0,6]\). d) Find an equation for \(f^{\prime}\) in the form \(f^{\prime}(x)=a\cos(bx)\).
Figure for problem 534495

Hints

- Use zeros and sign changes of \(f^{\prime}\) to classify local extrema of \(f\). - The function decreases where its derivative is negative. - Local extrema of \(f^{\prime}\) correspond to inflection points of \(f\). - Use amplitude and period to determine the cosine parameters.

Solution

1. The derivative is \(0\) at \(x=1.5\) and \(x=4.5\). It changes from positive to negative at \(x=1.5\), so \(f\) has a local maximum there. It changes from negative to positive at \(x=4.5\), so \(f\) has a local minimum there. 2. The function \(f\) is strictly decreasing where \(f^{\prime}<0\), which is \((1.5,4.5)\). 3. Inflection points of \(f\) occur where \(f^{\prime}\) changes from increasing to decreasing or vice versa. The periodic derivative has extrema at \(x=0\), \(x=3\), and \(x=6\), so these are the requested x-values. 4. The amplitude is \(2\), and the period is \(6\). Thus, \(a=2\) and \(b=\frac{2\pi}{6}=\frac{\pi}{3}\). Therefore, \(f^{\prime}(x)=2\cos(\frac{\pi}{3}x)\).

Answer

a) Local maximum at \(x=1.5\); local minimum at \(x=4.5\) b) \((1.5,4.5)\) c) \(x=0\), \(x=3\), and \(x=6\) d) \(f^{\prime}(x)=2\cos(\frac{\pi}{3}x)\)
Functions and their derivative graphs 187
The graph of \(f\) is shown. 1) Use the graph to estimate the inputs where \(f^{\prime}\) has zeros. 2) Describe the graph of \(f^{\prime}\), paying particular attention to the monotonicity of \(f\).
Figure for problem 534504

Hints

- Find the horizontal tangent lines on the graph of \(f\). - Use increasing and decreasing intervals to determine the derivative sign. - Identify where \(f\) has its most negative slope. - The derivative of a cubic polynomial is quadratic.

Solution

1. The derivative is zero at the local extrema of \(f\). From the graph, these occur near \(x=-1.4\) and \(x=1.4\). 2. The graph of \(f\) is increasing for \(x<-1.4\), decreasing for \(-1.4<x<1.4\), and increasing for \(x>1.4\). Therefore, \(f^{\prime}\) is positive, then negative, then positive across those intervals. 3. Since \(f\) is cubic, \(f^{\prime}\) is an upward-opening parabola. Its minimum occurs at \(x=0\), where the graph of \(f\) has its most negative slope.

Answer

1) The zeros are approximately \(x=-1.4\) and \(x=1.4\). 2) The derivative graph is an upward-opening parabola, positive outside the two zeros and negative between them, with a minimum at \(x=0\).
Functions and their derivative graphs 188
The graph of a bell-shaped function \(f\) is shown. 1) Describe the graph of \(f^{\prime}\). 2) Find the x-coordinates of the local extrema of \(f^{\prime}\). What do these inputs represent on the graph of \(f\)?
Figure for problem 534508

Hints

- The derivative is zero at the maximum of the bell curve. - Determine the derivative sign from increasing and decreasing behavior. - The extrema of the derivative occur where the original graph is steepest. - Use symmetry to check your description.

Solution

1. The graph of \(f\) is symmetric about the y-axis and has a maximum at \(x=0\). Therefore, \(f^{\prime}(0)=0\). The function increases for \(x<0\), so \(f^{\prime}(x)>0\), and decreases for \(x>0\), so \(f^{\prime}(x)<0\). 2. The local extrema of \(f^{\prime}\) occur where the graph of \(f\) is steepest. These are the inflection points of \(f\), at approximately \(x=-1\) and \(x=1\). 3. Thus, the derivative graph rises from values near zero to a local maximum near \(x=-1\), crosses the x-axis at \(x=0\), falls to a local minimum near \(x=1\), and approaches zero from below.

Answer

1) The derivative is positive for \(x<0\), zero at \(x=0\), and negative for \(x>0\), approaching \(0\) at both ends. 2) The local extrema of \(f^{\prime}\) occur at approximately \(x=-1\) and \(x=1\). These are the inflection points of \(f\).
Functions and their derivative graphs 189
The graph of \(f'\) is shown. Determine whether each statement about \(f\) is true or false. Justify each answer. (1) \(f\) has a local minimum at \(x=0\). (2) \(f\) is strictly decreasing on \((0,3)\). (3) \(f\) has an inflection point at \(x=0\). (4) \(f\) has local maxima at \(x=-3\) and \(x=3\).
Figure for problem 534521

Hints

- Use the sign of \(f'\) to determine whether \(f\) rises or falls. - A zero of \(f'\) gives an extremum only when the derivative changes sign. - For inflection points, track whether \(f'\) itself is increasing or decreasing.

Solution

1. Statement (1) is true. At \(x=0\), \(f'\) changes from negative to positive, so \(f\) has a local minimum. 2. Statement (2) is false. On \((0,3)\), \(f'>0\), so \(f\) is strictly increasing. 3. Statement (3) is false. An inflection point of \(f\) occurs where \(f'\) changes from increasing to decreasing or vice versa. At \(x=0\), \(f'\) is increasing through a zero, so the concavity of \(f\) does not change there. 4. Statement (4) is true. At both \(x=-3\) and \(x=3\), \(f'\) changes from positive to negative, so \(f\) has a local maximum.

Answer

(1) True (2) False (3) False (4) True
Functions and their derivative graphs 190
The function \(f(x)=\frac{4}{x^2+2}\) is represented by one of the four graphs shown. a) Which graph represents \(f\)? Justify your choice using characteristic features. b) Without differentiating, determine the number and location of the zeros of \(f'\). Use the graph of \(f\). c) Describe the symmetry of \(f\), and use it to predict the symmetry of \(f'\). d) Differentiate \(f\) to confirm your prediction. Then state the sign of \(f'\) on each side of its zero and give the horizontal asymptote of \(f'\).
Figure for problem 534522

Hints

- Compare the y-intercept, sign, and end behavior of the formula with the four graphs. - Horizontal tangents of \(f\) correspond to zeros of \(f'\). - Think about how differentiating an even graph affects symmetry. - Use the derivative formula only after making the graphical prediction.

Solution

1. Since \(f(0)=2\), \(f(x)>0\), and \(f(x)\to0\) as \(x\to\pm\infty\), graph (1) represents \(f\). 2. Zeros of \(f'\) occur where \(f\) has horizontal tangents. Graph (1) has exactly one horizontal tangent, at its maximum \(x=0\). Thus \(f'\) has exactly one zero at \(x=0\). 3. The function \(f\) is even, so its derivative \(f'\) is odd. 4. Differentiating gives \(f'(x)=-\frac{8x}{(x^2+2)^2}\). Thus \(f'(x)>0\) for \(x<0\), \(f'(0)=0\), and \(f'(x)<0\) for \(x>0\). Also \(f'(x)\to0\) as \(x\to\pm\infty\), so its horizontal asymptote is \(y=0\).

Answer

a) Graph (1) b) One zero: \(x=0\) c) \(f\) is even; \(f'\) is odd. d) \(f'(x)=-\frac{8x}{(x^2+2)^2}\); \(f'>0\) for \(x<0\), \(f'<0\) for \(x>0\); horizontal asymptote \(y=0\).
Functions and their derivative graphs 191
The graph of \(f'(x)=(x-1)e^{-x/2}\) is shown. a) Find the x-value where \(f\) has a local extremum. Classify it and justify your answer. b) Determine where \(f\) is concave up and concave down. Give the x-coordinate of the inflection point. c) Describe what happens to the slope of \(f\) as \(x\to\infty\). Explain why this fact alone does not determine whether \(f\) has a horizontal asymptote.
Figure for problem 534536

Hints

- Classify an extremum from the sign change of the first derivative. - Concavity depends on whether the derivative is increasing or decreasing. - A limiting slope describes steepness, not the actual height of the graph.

Solution

1. At \(x=1\), \(f'\) changes from negative to positive, so \(f\) has a local minimum there. 2. Differentiate the given derivative: \(f''(x)=\frac{3-x}{2}e^{-x/2}\). Since the exponential factor is positive, \(f''>0\) for \(x<3\) and \(f''<0\) for \(x>3\). Thus \(f\) is concave up for \(x<3\), concave down for \(x>3\), and has an inflection point at \(x=3\). 3. As \(x\to\infty\), \(f'(x)\to0\), so the graph of \(f\) becomes nearly horizontal. A slope approaching \(0\) does not by itself determine the function values, so it does not by itself prove that \(f\) approaches a horizontal asymptote.

Answer

a) Local minimum at \(x=1\) b) Concave up for \(x<3\); concave down for \(x>3\); inflection point at \(x=3\) c) \(f'(x)\to0\), so the graph becomes nearly horizontal; this alone does not prove a horizontal asymptote.
Functions and their derivative graphs 192
The graphs of functions \(f\) and \(g\) are shown. One function is the derivative of the other. a) Explain why \(g=f^{\prime}\). Use extrema and intervals of increase or decrease in your explanation. b) Estimate the interval on which the graph of \(f\) is concave down. c) Describe the general shape of \(f^{\prime\prime}\). Identify the important features of the graph of \(g\) that determine your description.
Figure for problem 534543

Hints

- Compare zeros of a possible derivative with extrema of the original function. - The sign of a derivative must agree with where the original function increases or decreases. - Because \(f^{\prime\prime}=g^{\prime}\), determine where \(g\) rises, falls, and has horizontal tangents. - Changes in the concavity of \(g\) help locate extrema of \(g^{\prime}\).

Solution

1. The graph of \(f\) has a local maximum at \(x=0\), and \(g\) has a zero there with a sign change from positive to negative. Also, \(f\) increases where \(g>0\) and decreases where \(g<0\). Therefore, \(g=f^{\prime}\). 2. The graph of \(f\) is concave down where \(f^{\prime\prime}(x)<0\). Since \(f^{\prime\prime}=g^{\prime}\), this occurs where \(g\) is decreasing, approximately on \((-0.6, 0.6)\). 3. The graph of \(f^{\prime\prime}\) has zeros near \(x=-0.6\) and \(x=0.6\), where \(g\) has local extrema. It is negative between these zeros and positive outside them in the displayed domain. 4. The steepest downward slope of \(g\) occurs at \(x=0\), so \(f^{\prime\prime}\) has a local minimum there. The changes in concavity of \(g\) near \(x=-1\) and \(x=1\) produce local maxima of \(f^{\prime\prime}\) near those x-values.

Answer

a) \(g=f^{\prime}\) because the zero and sign of \(g\) agree with the local maximum and monotonicity of \(f\). b) Approximately \((-0.6, 0.6)\) c) The graph of \(f^{\prime\prime}\) is positive outside approximately \((-0.6, 0.6)\), negative inside, has zeros near \(x=\pm0.6\), a local minimum at \(x=0\), and local maxima near \(x=\pm1\).
Functions and their derivative graphs 193
The graph of the derivative \(f^{\prime}\) of a continuous function \(f\) is shown. a) Find the intervals where \(f\) is strictly increasing and strictly decreasing. b) Find all local-extremum x-values of \(f\), and classify each. c) Where is \(f\) concave up? At what x-value does \(f\) have an inflection point? d) Given \(f(0)=4\), decide whether \(f(4)\) is greater than or less than \(4\). Justify your answer using the graph of \(f^{\prime}\).
Figure for problem 534560

Hints

- The sign of \(f^{\prime}\) determines monotonicity. - Sign changes of \(f^{\prime}\) classify local extrema. - The increasing or decreasing behavior of \(f^{\prime}\) determines concavity. - To compare the values at 0 and 4, look at the derivative sign between those inputs.

Solution

1. The derivative is positive on \((-4,-2)\) and \((4,6)\), so \(f\) is increasing there. It is negative on \((-2,4)\), so \(f\) is decreasing there. 2. At \(x=-2\), \(f^{\prime}\) changes from positive to negative, so \(f\) has a local maximum. At \(x=4\), it changes from negative to positive, so \(f\) has a local minimum. 3. The function \(f\) is concave up where \(f^{\prime}\) is increasing. The derivative has its minimum at \(x=1\) and increases for \(x>1\), so \(f\) is concave up on \((1,6)\) in the displayed interval. The inflection-point x-value is \(x=1\). 4. Since \(f^{\prime}(x)<0\) for \(0<x<4\), \(f\) is strictly decreasing on \([0,4]\). Therefore, \(f(4)<f(0)=4\).

Answer

a) Increasing on \((-4,-2)\) and \((4,6)\); decreasing on \((-2,4)\) b) Local maximum at \(x=-2\); local minimum at \(x=4\) c) Concave up on \((1,6)\); inflection point at \(x=1\) d) \(f(4)<4\)
Functions and their derivative graphs 194
The graph shows a function \(g\) and its derivative \(g^{\prime}\). The curves are labeled \(k\) and \(m\). a) Decide which curve represents \(g\) and which represents \(g^{\prime}\). Justify your choice. b) Find the slope of the graph of \(g\) at \(x=3\). c) At what x-value greater than \(0\) do \(g\) and \(g^{\prime}\) have the same value?
Figure for problem 534582

Hints

- Consider the degree of the derivative of a quadratic function. - A local extremum of the original function occurs where its derivative is zero. - Read the derivative value at \(x=3\) to find the tangent slope. - The function and derivative have the same value where their graphs intersect.

Solution

1. Curve \(k\) is a parabola and curve \(m\) is a line. Since the derivative of a quadratic function is linear, \(k\) represents \(g\) and \(m\) represents \(g^{\prime}\). This also agrees with the local minimum of \(k\) and the zero of \(m\) at \(x=0\). 2. The slope of \(g\) at \(x=3\) is \(g^{\prime}(3)\). From curve \(m\), \(g^{\prime}(3)=1.5\). 3. The curves intersect for \(x>0\) at \(x=2\). At that point, \(g(2)=g^{\prime}(2)=1\).

Answer

a) Curve \(k\) represents \(g\), and curve \(m\) represents \(g^{\prime}\). b) \(1.5\) c) \(x=2\)
Functions and their derivative graphs 195
The graph of \(f(x)=x^3-6x^2+9x\) is shown on \([-1,5]\). a) Find the critical numbers of \(f\). b) Give the open intervals in the displayed domain on which \(f\) is increasing and decreasing. c) Find an equation for \(f'(x)\), and determine where \(f'(x)\ge0\) on the displayed domain. d) At what x-value does \(f'\) attain its minimum? Explain the connection to the graph of \(f\). e) Determine the signs of \(f'(0)\) and \(f'(2)\).
Figure for problem 534654

Hints

- Differentiate and factor before making the sign chart. - Use the derivative's sign to determine monotonicity. - The minimum of the derivative corresponds to the point where its slope changes from negative to positive. - Compare the requested derivative values with zero rather than relying only on the graph.

Solution

1. Differentiate: \(f'(x)=3x^2-12x+9=3(x-1)(x-3)\). Thus the critical numbers are \(x=1\) and \(x=3\). 2. The derivative is positive on \((-1,1)\) and \((3,5)\), and negative on \((1,3)\). Therefore, \(f\) increases on \((-1,1)\) and \((3,5)\), and decreases on \((1,3)\). 3. On the displayed domain, \(f'(x)\ge0\) for \(x\in[-1,1]\cup[3,5]\). 4. The quadratic \(f'\) has its vertex midway between its zeros, at \(x=2\). This is where the slope of \(f\) is smallest and where \(f''\) changes sign, so \(x=2\) is the inflection-point x-coordinate of \(f\). 5. \(f'(0)=9>0\), while \(f'(2)=-3<0\).

Answer

a) \(x=1\) and \(x=3\) b) Increasing on \((-1,1)\) and \((3,5)\); decreasing on \((1,3)\) c) \(f'(x)=3(x-1)(x-3)\); \(f'(x)\ge0\) on \([-1,1]\cup[3,5]\) d) \(x=2\); it is the inflection-point x-coordinate of \(f\). e) \(f'(0)>0\) and \(f'(2)<0\)
Functions and their derivative graphs 196
The graph of \(f'\) is shown. a) Find every x-value where \(f\) has a local minimum. Justify your answer. b) At approximately what x-values does \(f\) have inflection points? c) Determine whether the following statement is true or false: “\(f\) is strictly increasing for every displayed \(x>3\).” Justify your answer.
Figure for problem 534715

Hints

- A negative-to-positive sign change of the derivative gives a local minimum. - Inflection points of \(f\) correspond to local extrema of \(f'\). - Read increasing behavior of \(f\) from where \(f'\) is positive.

Solution

1. A local minimum of \(f\) occurs where \(f'\) changes from negative to positive. The graph shows this at \(x=-4\) and \(x=3\). 2. Inflection points of \(f\) occur where \(f'\) has local extrema. From the graph, these x-values are approximately \(x=-2.7\) and \(x=1.4\). 3. The statement is true. For every displayed \(x>3\), the graph of \(f'\) is above the x-axis, so \(f'(x)>0\) and \(f\) is strictly increasing there.

Answer

a) \(x=-4\) and \(x=3\) b) Approximately \(x=-2.7\) and \(x=1.4\) c) True; \(f'(x)>0\) for every displayed \(x>3\).
Functions and their derivative graphs 197
Graphs 1, 2, and 3 represent a function \(f\), its first derivative \(f'\), and its second derivative \(f''\). Identify each graph and justify your matches by comparing zeros, local extrema, and increasing/decreasing behavior.
Figure for problem 534838

Hints

- Zeros of a derivative correspond to horizontal tangents of the function one level above it. - Compare derivative signs with increasing and decreasing intervals. - Build the derivative chain one link at a time.

Solution

1. Graph 3 has a local minimum at \(x=0\). Graph 1 is zero there and changes from negative to positive, so Graph 1 is the derivative of Graph 3. 2. Graph 1 has local extrema at \(x=-1\) and \(x=1\). Graph 2 is zero at those x-values, and its sign matches where Graph 1 increases or decreases. Therefore, Graph 2 is the derivative of Graph 1. 3. Thus Graph 3 is \(f\), Graph 1 is \(f'\), and Graph 2 is \(f''\).

Answer

Graph 1: \(f'\); Graph 2: \(f''\); Graph 3: \(f\)
Functions and their derivative graphs 198
The graph of a quartic polynomial \(f\) is shown. a) Use the graph to estimate the zeros of \(f'\) and \(f''\). b) On \(0\le x\le1.73\), where does \(f\) decrease most steeply? Explain your choice. c) Describe the shape of the graph of \(f'\), including its zeros and local extrema.
Figure for problem 534868

Hints

- Where does the graph of \(f\) have horizontal tangent lines? - How are inflection points of \(f\) related to local extrema of \(f'\)? - On the decreasing part of the graph, where is the slope most negative? - Use degree and symmetry to describe the graph of \(f'\).

Solution

1. The derivative \(f'\) is zero at horizontal tangents of \(f\): approximately \(x=-1.73\), \(x=0\), and \(x=1.73\). 2. The second derivative \(f''\) is zero at inflection points of \(f\), at \(x=-1\) and \(x=1\). 3. On \([0,1.73]\), the slope is most negative at \(x=1\), where \(f'\) has a local minimum. 4. Because \(f\) is an even quartic, \(f'\) is an odd cubic. It has zeros near \(-1.73,0,1.73\), a local maximum at \(x=-1\), and a local minimum at \(x=1\).

Answer

a) Zeros of \(f'\): \(x\approx-1.73,0,1.73\). Zeros of \(f''\): \(x=-1,1\). b) \(x=1\), where \(f'\) is smallest. c) An odd cubic with zeros near \(-1.73,0,1.73\), a local maximum at \(x=-1\), and a local minimum at \(x=1\).
Functions and their derivative graphs 199
A differentiable function \(h\) has the piecewise-linear derivative shown on \([-5,5]\). Use the graph of \(h'\) to give all of the following for \(h\): a) maximal open intervals of increase and decrease; b) x-coordinates and classifications of all local extrema; c) maximal open intervals of concavity; d) x-coordinates of all inflection points.
Figure for problem 550333

Hints

- Use the derivative's sign for one set of features and the derivative's rise or fall for another. - Treat zeros of the derivative and turning points of the derivative graph as different kinds of information. - Work through monotonicity and concavity separately before combining the conclusions.

Solution

1. The derivative is positive on \((-5,-3)\) and \((1,5)\), and negative on \((-3,1)\). Thus \(h\) increases on \((-5,-3)\) and \((1,5)\), and decreases on \((-3,1)\). 2. At \(x=-3\), \(h'\) changes from positive to negative, so \(h\) has a local maximum. At \(x=1\), it changes from negative to positive, so \(h\) has a local minimum. 3. The graph of \(h'\) decreases on \((-5,-1)\), increases on \((-1,3)\), and decreases on \((3,5)\). Therefore, \(h\) is concave down on \((-5,-1)\) and \((3,5)\), and concave up on \((-1,3)\). 4. Concavity changes at \(x=-1\) and \(x=3\), so these are inflection-point x-coordinates.

Answer

a) Increasing on \((-5,-3)\) and \((1,5)\); decreasing on \((-3,1)\). b) Local maximum at \(x=-3\); local minimum at \(x=1\). c) Concave down on \((-5,-1)\) and \((3,5)\); concave up on \((-1,3)\). d) Inflection-point x-coordinates: \(x=-1\) and \(x=3\).
Functions and their derivative graphs 200
The table gives values of \(p'\). Assume \(p'\) is linear between consecutive listed x-values. <table> <tr><th>\(x\)</th><th>\(p'(x)\)</th></tr> <tr><td>\(-4\)</td><td>\(3\)</td></tr> <tr><td>\(-2\)</td><td>\(0\)</td></tr> <tr><td>\(0\)</td><td>\(-2\)</td></tr> <tr><td>\(2\)</td><td>\(0\)</td></tr> <tr><td>\(4\)</td><td>\(4\)</td></tr> </table> a) Give the maximal open intervals on which \(p\) is increasing and decreasing. b) Classify the critical numbers \(x=-2\) and \(x=2\). c) On which maximal open intervals is \(p\) concave up or concave down?

Hints

- Use the sign of the derivative to determine how the original function moves. - At a zero of the derivative, compare the signs on the two sides before classifying it. - For concavity, look for where the derivative values trend downward or upward.

Solution

1. Because \(p'\) is positive on \((-4,-2)\), negative on \((-2,2)\), and positive on \((2,4)\), \(p\) increases on \((-4,-2)\) and \((2,4)\), and decreases on \((-2,2)\). 2. At \(x=-2\), \(p'\) changes from positive to negative, so \(p\) has a local maximum. At \(x=2\), it changes from negative to positive, so \(p\) has a local minimum. 3. The listed values of \(p'\) decrease from \(x=-4\) to \(x=0\), then increase from \(x=0\) to \(x=4\). Therefore, \(p\) is concave down on \((-4,0)\) and concave up on \((0,4)\).

Answer

a) Increasing on \((-4,-2)\) and \((2,4)\); decreasing on \((-2,2)\). b) Local maximum at \(x=-2\); local minimum at \(x=2\). c) Concave down on \((-4,0)\); concave up on \((0,4)\).
Functions and their derivative graphs 201
The graph of \(f\) is shown. 1) Record the notable inputs, including local extrema and horizontal inflection points, in a table and give the corresponding values of \(f^{\prime}\). 2) Use this information to describe the graph of \(f^{\prime}\).
Figure for problem 533722

Hints

- Find each point where the graph of \(f\) has a horizontal tangent line. - Distinguish a local extremum from a horizontal inflection point. - Determine the sign of the derivative from the increasing and decreasing intervals. - A sign change produces a crossing; no sign change produces a touch.

Solution

1. The notable points give the following table: <table> <tr><th>Input \(x\)</th><th>Type of point on \(f\)</th><th>Value of \(f^{\prime}(x)\)</th></tr> <tr><td>\(0\)</td><td>Local minimum</td><td>\(0\)</td></tr> <tr><td>\(3\)</td><td>Horizontal inflection point</td><td>\(0\)</td></tr> </table> 2. For \(x<0\), the function is decreasing, so \(f^{\prime}(x)<0\). For \(0<x<3\), the function is increasing, so \(f^{\prime}(x)>0\). For \(x>3\), the function continues increasing, so \(f^{\prime}(x)>0\). 3. The derivative graph crosses the x-axis at \(x=0\), changing from negative to positive. At \(x=3\), it touches the x-axis from above without changing sign. One additional reference value is \(f^{\prime}(1)\approx0.8\).

Answer

The derivative has zeros at \(x=0\) and \(x=3\). At \(x=0\), it changes sign from negative to positive and crosses the x-axis. At \(x=3\), it remains positive on both sides and touches the x-axis.
Functions and their derivative graphs 202
The four panels show the graphs of a function \(f\) and its first three derivatives \(f'\), \(f''\), and \(f'''\). Match each panel to the correct function. Briefly justify your choices by comparing zeros, extrema, signs, and slopes.
Figure for problem 534545

Hints

- Zeros of a derivative correspond to horizontal tangents of the function one level above it. - Compare the sign of a possible derivative with where the preceding graph increases or decreases. - Apply the same derivative relationship repeatedly through the four panels.

Solution

1. Graph 4 has a local minimum at \(x=0\). Graph 3 is zero there and changes from negative to positive, so Graph 3 is the derivative of Graph 4. Thus Graph 4 is \(f\) and Graph 3 is \(f'\). 2. Graph 3 has local extrema near \(x=\pm1.6\). Graph 1 is zero at those x-values, and its sign matches where Graph 3 increases or decreases. Thus Graph 1 is \(f''\). 3. Graph 1 has local extrema at \(x=0\) and near \(x=\pm2.7\). Graph 2 is zero at those x-values, with signs matching the increase and decrease of Graph 1. Thus Graph 2 is \(f'''\).

Answer

Graph 1: \(f''\); Graph 2: \(f'''\); Graph 3: \(f'\); Graph 4: \(f\)

All problems may be used, copied and printed free of charge for school and tutoring, including paid tutoring. Commercial adaptations as well as publication or redistribution on the internet are not permitted.