Aimathic
Login | English | Deutsch

Free Math Worksheets

Build your own math worksheets from 21,000 problems for grades 3 to 12, from fractions to calculus. Every problem includes step-by-step solutions.

Definite integral notation

Click problems to add them to your worksheet.

53461812
The graph of a constant function \(f\) is shown. Use the graph to evaluate \(\int_{-2}^{3}f(x)\,dx\).
Figure for problem 534618

Hints

- Read the constant function value from the graph. - Find the width and height of the rectangle. - Use a negative signed area for a region below the \(x\)-axis.

Solution

1. The graph is the horizontal line \(y=-2\), so \(f(x)=-2\). 2. On \([-2,3]\), the region between the graph and the \(x\)-axis is a rectangle below the axis. 3. Its width is \(3-(-2)=5\), and its height is \(2\). 4. Because it lies below the \(x\)-axis, its signed contribution is \(-5\cdot 2=-10\).

Answer

\(\int_{-2}^{3}f(x)\,dx=-10\)
53461912
Use the graph of \(f\) to evaluate \(\int_{-3}^{1}f(x)\,dx\).
Figure for problem 534619

Hints

- Read the function value from the graph. - Find the width of the integration interval. - Interpret the region as a rectangle.

Solution

1. The graph is the horizontal line \(y=1.5\), so the function is constant and positive. 2. The interval width is \(1-(-3)=4\). 3. The region is a rectangle with width \(4\) and height \(1.5\), so the integral is \(4\cdot 1.5=6\).

Answer

\(\int_{-3}^{1}f(x)\,dx=6\)
53464312
The graph of \(f(x)=\frac{1}{2}x^2+1\) is shown. Write the definite integral that represents the net signed area of the shaded region on \([0,2]\).
Figure for problem 534643

Hints

- Read the left and right boundaries of the shaded region from the \(x\)-axis. - A definite integral represents net signed area between a graph and the \(x\)-axis. - Use the left boundary as the lower limit and the right boundary as the upper limit.

Solution

1. The function is \(f(x)=\frac{1}{2}x^2+1\). 2. The shaded region extends from \(x=0\) to \(x=2\). 3. Therefore, the net signed area is represented by \(\int_{0}^{2}\left(\frac{1}{2}x^2+1\right)\,dx\).

Answer

\(\int_{0}^{2}\left(\frac{1}{2}x^2+1\right)\,dx\)
53464912
Let \(f(x)=\frac{1}{2}x-1\). The marked region lies between the graph and the \(x\)-axis from \(x=0\) to \(x=4\). Write the definite integral that represents the net signed area.
Figure for problem 534649

Hints

- Net signed area uses the signs of the function values. - One definite integral over the entire interval automatically combines regions above and below the \(x\)-axis.

Solution

1. The function is \(f(x)=\frac{1}{2}x-1\). 2. The interval extends from \(x=0\) to \(x=4\). 3. Therefore, the net signed area is represented by \(\int_{0}^{4}\left(\frac{1}{2}x-1\right)\,dx\). The function changes sign at \(x=2\), and the integral automatically combines the negative and positive contributions.

Answer

\(\int_{0}^{4}\left(\frac{1}{2}x-1\right)\,dx\)
52455712
Evaluate \(\int_{-1}^{4} (0.5x + 3)\,dx\) by interpreting the region between the graph of the integrand and the \(x\)-axis as a geometric figure. Use the area of that figure.

Hints

- Sketch the graph on the given interval. - Identify the geometric figure formed by the graph and the \(x\)-axis. - Recall the area formulas for rectangles, triangles, and trapezoids. - Relate the endpoint function values to the side lengths of the figure.

Solution

1. The graph of \(f(x)=0.5x+3\) is a line. On \([-1,4]\), its endpoint values are \(f(-1)=2.5\) and \(f(4)=5\), so the region between the graph and the \(x\)-axis is a trapezoid entirely above the axis. 2. The parallel sides of the trapezoid have lengths \(2.5\) and \(5\). The distance between them is the interval length, \(4-(-1)=5\). 3. Its area is \(A=\frac{2.5+5}{2}\cdot 5=3.75\cdot 5=18.75\). 4. Because the region lies above the \(x\)-axis, the definite integral equals this area. Therefore, the integral is \(18.75\).

Answer

\(\int_{-1}^{4} (0.5x + 3)\,dx=18.75\)
52970312
Evaluate each definite integral. Pay attention to the variable of integration; treat every other letter as a constant. a) \(\int_1^3(4x^3y-2y^2)\,dx\) b) \(\int_1^3(4x^3y-2y^2)\,dy\) c) \(\int_0^1a^2\,dx\)

Hints

- The variable after \(d\) is the variable of integration. - Treat all other letters as constants. - Use the power rule in the selected variable. - Integrating a constant over an interval multiplies it by the interval length.

Solution

1. For a), integrate with respect to \(x\): \(\int(4x^3y-2y^2)\,dx=x^4y-2xy^2\). Evaluating from \(1\) to \(3\) gives \(80y-4y^2\). 2. For b), integrate with respect to \(y\): \(\int(4x^3y-2y^2)\,dy=2x^3y^2-\frac{2}{3}y^3\). Evaluating from \(1\) to \(3\) gives \(16x^3-\frac{52}{3}\). 3. For c), \(a^2\) is constant with respect to \(x\): \(\int_0^1a^2\,dx=a^2\).

Answer

a) \(80y-4y^2\) b) \(16x^3-\frac{52}{3}\) c) \(a^2\)
52970412
Evaluate each integral in terms of the remaining parameters and variables. a) \(\int_0^k t^3\,dt\) b) \(\int_0^t k^3\,dk\) c) \(\int_0^1 e^z w\,dz\) d) \(\int_0^1 e^z w\,dw\)

Hints

- Identify the variable after \(d\). - Treat every other letter as a constant. - After applying the bounds, the result should not contain the variable of integration. - Distinguish \(e^z w\) from \(e^{zw}\).

Solution

1. For a), integrate with respect to \(t\): \(\left[\frac{t^4}{4}\right]_0^k=\frac{k^4}{4}\). 2. For b), integrate with respect to \(k\): \(\left[\frac{k^4}{4}\right]_0^t=\frac{t^4}{4}\). 3. For c), \(w\) is constant with respect to \(z\): \(w[e^z]_0^1=w(e-1)\). 4. For d), \(e^z\) is constant with respect to \(w\): \(e^z\left[\frac{w^2}{2}\right]_0^1=\frac{e^z}{2}\).

Answer

a) \(\frac{k^4}{4}\) b) \(\frac{t^4}{4}\) c) \(w(e-1)\) d) \(\frac{e^z}{2}\)
53268212
The graph shown represents a piecewise linear function \(f\). Evaluate \(\int_{-4}^{4}f(x)\,dx\) using net signed area.
Figure for problem 532682

Hints

- Interpret the definite integral as net signed area. - Identify which regions lie above and below the \(x\)-axis. - Divide the regions into triangles or other simple shapes. - Find the \(x\)-intercepts before combining the signed areas.

Solution

1. Split the interval at the zeros \(x=-2\) and \(x=3\). 2. On \([-4,-2]\), the graph forms a triangle below the \(x\)-axis with base \(2\) and height \(2\). Its signed contribution is \(-\frac{1}{2}\cdot 2\cdot 2=-2\). 3. On \([-2,3]\), the graph forms a triangle above the \(x\)-axis with base \(5\) and height \(2\). Its contribution is \(\frac{1}{2}\cdot 5\cdot 2=5\). 4. On \([3,4]\), the graph forms a triangle below the \(x\)-axis with base \(1\) and height \(2\). Its signed contribution is \(-\frac{1}{2}\cdot 1\cdot 2=-1\). 5. Therefore, \(\int_{-4}^{4}f(x)\,dx=-2+5-1=2\).

Answer

\(2\)
53268612
The graph shown represents a piecewise linear function \(f\) on \([-3,5]\). Evaluate \(\int_{-3}^{5}f(x)\,dx\) using net signed area.
Figure for problem 532686

Hints

- Interpret the definite integral as net signed area. - Separate regions above and below the \(x\)-axis. - Divide the regions into triangles and rectangles. - Combine the areas with the correct signs.

Solution

1. Divide the regions between the graph and the \(x\)-axis into triangles and a rectangle. 2. Above the \(x\)-axis, the triangle on \([-3,0]\) has area \(\frac{1}{2}\cdot 3\cdot 2=3\), and the triangle on \([4,5]\) has area \(\frac{1}{2}\cdot 1\cdot 2=1\). The total positive contribution is \(4\). 3. Below the \(x\)-axis, the triangle on \([0,1]\) has area \(1\), the rectangle on \([1,3]\) has area \(4\), and the triangle on \([3,4]\) has area \(1\). The total magnitude of the negative contribution is \(6\). 4. Therefore, \(\int_{-3}^{5}f(x)\,dx=4-6=-2\).

Answer

\(-2\)
53461612
In figures a)–c), boundary lines mark a region between a graph and the \(x\)-axis. Match each figure to the corresponding integral below. Justify each match. 1. \(\int_0^4(0.5x+1)\,dx\) 2. \(\int_0^2(x-2)^2\,dx\) 3. \(\int_1^4\frac{4}{x}\,dx\) 4. \(\int_0^2x^2\,dx\) 5. \(\int_1^4\frac{1}{x}\,dx\) 6. \(\int_0^4(0.5x^2+1)\,dx\)
Figure for problem 534616

Hints

- Compare the horizontal boundaries in each figure with the limits of integration. - Identify whether each graph is linear, quadratic, or reciprocal. - Check key features such as an intercept, a vertex, or points on the graph. - Distinguish a shifted parabola from \(y=x^2\).

Solution

1. Figure a) shows a line with \(y\)-intercept \(1\), slope \(0.5\), and boundaries at \(x=0\) and \(x=4\). It matches integral (1). 2. Figure b) shows an upward-opening parabola with vertex \((2,0)\), so its equation is \(y=(x-2)^2\). The boundaries are \(x=0\) and \(x=2\), so it matches integral (2). 3. Figure c) shows a reciprocal graph through \((1,4)\) and \((4,1)\). For \(y=\frac{k}{x}\), the point \((1,4)\) gives \(k=4\). The boundaries are \(x=1\) and \(x=4\), so it matches integral (3).

Answer

a) Integral (1) b) Integral (2) c) Integral (3)
53462112
The graph of a linear function \(f\) is shown. Evaluate \(\int_{-2}^{4}f(x)\,dx\) by interpreting it as net signed area.
Figure for problem 534621

Hints

- Identify the regions above and below the \(x\)-axis. - Find the dimensions of the two triangles. - Add their signed areas.

Solution

1. The graph crosses the \(x\)-axis at \(x=2\). 2. On \([-2,2]\), the graph forms a triangle above the axis with base \(4\) and height \(2\). Its contribution is \(\frac{1}{2}\cdot 4\cdot 2=4\). 3. On \([2,4]\), the graph forms a triangle below the axis with base \(2\) and height \(1\). Its signed contribution is \(-\frac{1}{2}\cdot 2\cdot 1=-1\). 4. The integral is \(4-1=3\).

Answer

\(\int_{-2}^{4}f(x)\,dx=3\)
53462212
Evaluate \(\int_{-3}^{2}f(x)\,dx\) for the function shown.
Figure for problem 534622

Hints

- Divide the region into triangles. - Find where the graph changes sign. - Add the signed areas above and below the \(x\)-axis.

Solution

1. The graph has zeros at \(x=-3\) and \(x=1\), with a maximum at \((-1,2)\). 2. On \([-3,1]\), the graph forms a triangle above the \(x\)-axis with base \(4\) and height \(2\). Its area is \(\frac{1}{2}\cdot 4\cdot 2=4\). 3. On \([1,2]\), the graph forms a triangle below the axis with base \(1\) and height \(1\). Its signed contribution is \(-\frac{1}{2}\cdot 1\cdot 1=-0.5\). 4. Therefore, \(\int_{-3}^{2}f(x)\,dx=4-0.5=3.5\).

Answer

\(\int_{-3}^{2}f(x)\,dx=3.5\)
53462312
Use the graph to evaluate \(\int_{-2}^{3}f(x)\,dx\).
Figure for problem 534623

Hints

- Interpret the integral as net signed area. - Find the base and height of each triangle. - Use a negative contribution for the region below the \(x\)-axis.

Solution

1. The graph crosses the \(x\)-axis at \(x=1\). 2. On \([-2,1]\), the graph forms a triangle above the axis with base \(3\) and height \(3\). Its contribution is \(\frac{1}{2}\cdot 3\cdot 3=4.5\). 3. On \([1,3]\), the graph forms a triangle below the axis with base \(2\) and height \(2\). Its signed contribution is \(-\frac{1}{2}\cdot 2\cdot 2=-2\). 4. Therefore, \(\int_{-2}^{3}f(x)\,dx=4.5-2=2.5\).

Answer

\(\int_{-2}^{3}f(x)\,dx=2.5\)
53463312
The graph of a linear function \(f\) is shown. Evaluate \(\int_{-1}^{2}f(x)\,dx\) using net signed area.
Figure for problem 534633

Hints

- Find where the graph crosses the \(x\)-axis. - Divide the interval into regions that lie entirely above or below the axis. - Use a negative signed area for the region below the axis.

Solution

1. The graph crosses the \(x\)-axis at \(x=1\). It lies below the axis on \([-1,1]\) and above it on \([1,2]\). 2. The triangle below the axis has base \(2\) and height \(2\), so its signed contribution is \(-\frac{1}{2}\cdot 2\cdot 2=-2\). 3. The triangle above the axis has base \(1\) and height \(1\), so its contribution is \(\frac{1}{2}\cdot 1\cdot 1=0.5\). 4. Therefore, \(\int_{-1}^{2}f(x)\,dx=-2+0.5=-1.5\).

Answer

The integral is \(-1.5\).
53463512
Use the graph of \(f\) to evaluate \(\int_{-2}^{2}f(x)\,dx\).
Figure for problem 534635

Hints

- Use the graph's symmetry to reduce the work. - Identify the positive and negative triangular regions. - Check whether their signed contributions cancel.

Solution

1. The graph is symmetric about the \(y\)-axis and crosses the \(x\)-axis at \(x=-1\) and \(x=1\). 2. By symmetry, calculate the integral on \([0,2]\) and double it. 3. On \([0,1]\), the graph forms a triangle below the axis with base \(1\) and height \(1\), contributing \(-0.5\). 4. On \([1,2]\), the graph forms a congruent triangle above the axis, contributing \(0.5\). 5. Thus, \(\int_{0}^{2}f(x)\,dx=-0.5+0.5=0\), and \(\int_{-2}^{2}f(x)\,dx=2\cdot 0=0\).

Answer

The integral is \(0\).
52955512
Let \(f(x)=x^2-4\). 1) Without calculating, use the graph of \(f\) to determine the sign of \(\int_{0}^{2}f(x)\,dx\). 2) Use the graph’s key features on \([0,4]\) to make a justified prediction about the sign of \(\int_{0}^{4}f(x)\,dx\). 3) Evaluate both integrals to check your predictions.

Hints

- Find the zeros of the function and determine where its graph is above or below the \(x\)-axis. - Remember that regions below the \(x\)-axis contribute negatively to a definite integral. - Compare the positive and negative signed-area contributions before calculating.

Solution

1. On \([0,2]\), the graph lies on or below the \(x\)-axis because \(x^2-4\leq 0\). It is below the axis except at \(x=2\), so the definite integral is negative. 2. On \([0,4]\), the graph is below the \(x\)-axis from \(0\) to \(2\) and above it from \(2\) to \(4\). The positive signed-area contribution is larger, so the integral should be positive. 3. An antiderivative is \(F(x)=\frac{1}{3}x^3-4x\). Therefore, \(\int_{0}^{2}(x^2-4)\,dx=F(2)-F(0)=\frac{8}{3}-8=-\frac{16}{3}\), and \(\int_{0}^{4}(x^2-4)\,dx=F(4)-F(0)=\frac{64}{3}-16=\frac{16}{3}\). Both calculations confirm the predictions.

Answer

1) \(\int_{0}^{2}f(x)\,dx\) is negative. 2) The graph’s key features indicate that \(\int_{0}^{4}f(x)\,dx\) is positive. 3) \(\int_{0}^{2}f(x)\,dx=-\frac{16}{3}\) and \(\int_{0}^{4}f(x)\,dx=\frac{16}{3}\).
52956212
The function \(f\) is defined by \(f(x)=\begin{cases}2&\text{if }x\leq 1\\3-x&\text{if }x>1\end{cases}\). Evaluate \(\int_{-2}^{5}f(x)\,dx\) using the areas of geometric regions.

Hints

- Split the integral where the function rule changes. - Check whether the graph crosses the \(x\)-axis within either piece. - Identify the rectangles and triangles formed by the graph. - Use a negative contribution for any region below the \(x\)-axis.

Solution

1. Split the interval at \(x=1\), where the formula changes, and at \(x=3\), where \(3-x=0\). 2. On \([-2,1]\), the graph forms a rectangle of width \(3\) and height \(2\), contributing \(3\cdot 2=6\). 3. On \([1,3]\), the graph forms a triangle above the \(x\)-axis with base \(2\) and height \(2\), contributing \(\frac{1}{2}\cdot 2\cdot 2=2\). 4. On \([3,5]\), the graph forms a congruent triangle below the \(x\)-axis, contributing \(-\frac{1}{2}\cdot 2\cdot 2=-2\). 5. The net signed area is \(6+2-2=6\).

Answer

\(6\)
52979112
A function \(f\) is piecewise linear on \([0,7]\). Its graph consists of line segments connecting, in order, the points \(A(0,2)\), \(B(2,2)\), \(C(5,-1)\), and \(D(7,-1)\). Evaluate \(\int_{0}^{7}f(x)\,dx\) by calculating net signed area between the graph and the \(x\)-axis.

Hints

- Use the listed points to analyze the connected line segments. - Divide the region into rectangles and triangles. - Find where the graph crosses the \(x\)-axis. - Treat areas below the \(x\)-axis as negative contributions.

Solution

1. The segment from \(B(2,2)\) to \(C(5,-1)\) has slope \(-1\), so its equation is \(y=-x+4\). It crosses the \(x\)-axis at \(x=4\). 2. Above the \(x\)-axis, the rectangle from \(x=0\) to \(x=2\) contributes \(2\cdot 2=4\), and the triangle from \(x=2\) to \(x=4\) contributes \(\frac{1}{2}\cdot 2\cdot 2=2\). 3. Below the \(x\)-axis, the triangle from \(x=4\) to \(x=5\) has area \(\frac{1}{2}\cdot 1\cdot 1=0.5\), and the rectangle from \(x=5\) to \(x=7\) has area \(2\cdot 1=2\). These contribute negatively. 4. The net signed area is \(4+2-0.5-2=3.5\).

Answer

\(\int_{0}^{7}f(x)\,dx=3.5\)
53268412
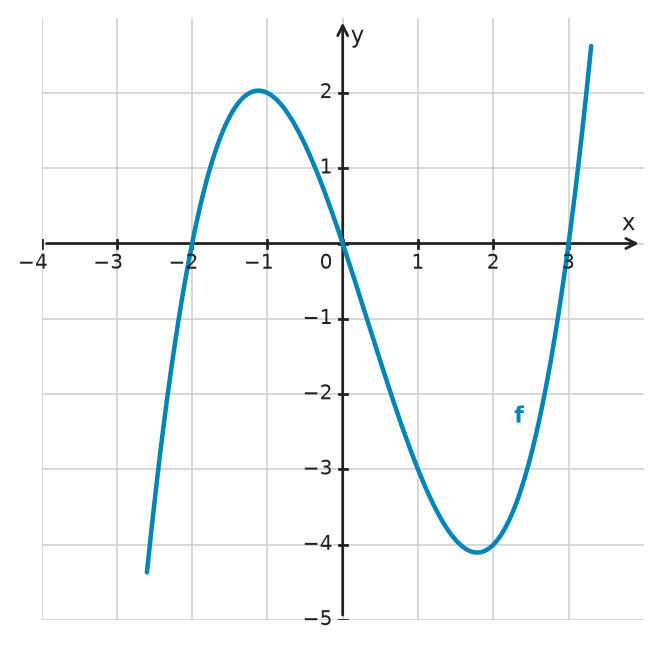
The graph of \(f\) is shown. Determine whether each statement is true or false. Justify your conclusions with geometric estimates, such as triangles or grid-square counts. a) \(\int_{-2}^{3}f(x)\,dx<0\) b) \(\int_{0}^{3}f(x)\,dx>-5\) c) \(\int_{-2}^{0}f(x)\,dx>\int_{-2}^{0}1\,dx\)
Figure for problem 532684

Hints

- Relate each definite integral to signed area between the graph and the \(x\)-axis. - Identify where the graph is above and below the axis. - Bound curved regions with triangles or rectangles. - Interpret the integral of the constant function \(1\) geometrically.

Solution

1. For a), the positive region on \([-2,0]\) is smaller than the negative region on \([0,3]\). The net signed area is negative, so the statement is true. Numerically, the integral is about \(-5.21\). 2. For b), the region below the \(x\)-axis contains the triangle with vertices \((0,0)\), \((2,-4)\), and \((3,0)\), whose area is \(\frac{1}{2}\cdot 3\cdot 4=6\). The curve lies below the two slanted sides of this triangle, so the magnitude of the negative area is greater than \(6\). Thus, \(\int_{0}^{3}f(x)\,dx<-6\), and the statement is false. 3. For c), \(\int_{-2}^{0}1\,dx=2\). The region under \(f\) contains the triangle with vertices \((-2,0)\), \((-1,2)\), and \((0,0)\), which has area \(2\). Since the graph lies above the triangle's slanted sides, \(\int_{-2}^{0}f(x)\,dx>2\). The statement is true.

Answer

a) True. The negative signed area on \([0,3]\) has greater magnitude than the positive signed area on \([-2,0]\). b) False. In fact, \(\int_{0}^{3}f(x)\,dx<-6\). c) True. \(\int_{-2}^{0}f(x)\,dx>2=\int_{-2}^{0}1\,dx\).
53274412
The graph of \(f(x)=-0.1x^2+1.6\) and a red rectangle are shown. Use the figure to justify that \(\int_{-3}^{3}f(x)\,dx>6\).
Figure for problem 532744

Hints

- Find the width, height, and area of the red rectangle. - Interpret the definite integral as area under the graph on this interval. - Use the grid to make lower rectangular estimates on \([-2,2]\) and on the two edge intervals.

Solution

1. The red rectangle has width \(6\), from \(x=-3\) to \(x=3\), and height \(1\). Its area is \(6\cdot 1=6\). 2. The graph is above the \(x\)-axis throughout \([-3,3]\), so the definite integral is the area under the graph. 3. On \([-2,2]\), the graph has height at least \(f(2)=f(-2)=1.2\). Therefore, the area under the graph on this central interval is greater than \(4\cdot 1.2=4.8\). 4. On the two edge intervals \([-3,-2]\) and \([2,3]\), the graph has height at least \(f(3)=f(-3)=0.7\). Their combined area is greater than \(2\cdot 0.7=1.4\). 5. Thus, the area under the graph is greater than \(4.8+1.4=6.2\), so \(\int_{-3}^{3}f(x)\,dx>6\).

Answer

The red rectangle has area \(6\). The area under the graph is greater than \(4\cdot 1.2+2\cdot 0.7=6.2\), using lower rectangular estimates from the grid. Therefore, \(\int_{-3}^{3}f(x)\,dx>6\).

All problems may be used, copied and printed free of charge for school and tutoring, including paid tutoring. Commercial adaptations as well as publication or redistribution on the internet are not permitted.